The Global Streamer Map: Supply Distribution Across 25 Countries

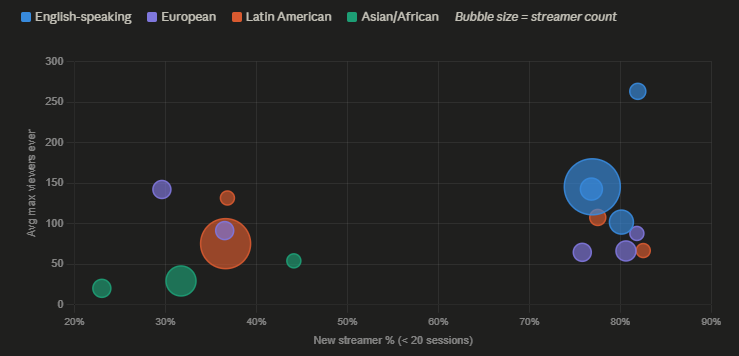
Kenya has the highest proportion of veteran streamers of any country in this dataset at 32.2%. Australia has the highest proportion of new streamers at 81.9%. Both are outliers — but for entirely different structural reasons that reveal how geography shapes streaming careers in ways that content strategy alone cannot overcome.
The platform's streamer population spans at least 25 countries with 50 or more active participants. These countries differ not just in how many streamers they contribute but in the career stage distribution, historical performance, and growth efficiency of their streamer populations. Understanding these structural differences provides a clearer picture of where the platform's competitive dynamics are most and least favorable — and why geography remains one of the variables most resistant to strategic adjustment.
The Supply Landscape: 25 Countries in Context
| Country | Streamers | Avg followers | Avg max viewers | Avg sessions ever | Avg hours ever |
|---|---|---|---|---|---|
| Unknown | 32,505 | 31,056 | 283.8 | 26.7 | 62.1 |
| Colombia | 27,976 | 13,803 | 75.4 | 27.0 | 88.9 |
| US | 21,283 | 9,331 | 145.5 | 14.3 | 17.3 |
| Philippines | 4,083 | 4,084 | 29.4 | 42.7 | 66.2 |
| GB | 2,718 | 7,056 | 102.0 | 13.2 | 14.4 |
| Canada | 2,271 | 11,058 | 142.7 | 14.3 | 18.0 |
| Germany | 1,946 | 4,829 | 66.4 | 12.3 | 14.2 |
| Ukraine | 1,257 | 18,589 | 142.2 | 41.6 | 83.0 |
| Kenya | 1,177 | 2,660 | 20.3 | 79.9 | 125.1 |
| Romania | 1,146 | 30,093 | 91.5 | 32.4 | 88.4 |
| Australia | 1,112 | 7,033 | 263.2 | 11.9 | 13.4 |
| Venezuela | 679 | 15,134 | 131.7 | 28.1 | 81.5 |
| Madagascar | 259 | 1,112 | 11.2 | 110.0 | 132.6 |
The three largest populations — Unknown, Colombia, and the US — together account for more than 80,000 streamers, over 80% of the tracked global supply. The structural differences between them are substantial.
Colombia's 27,976 streamers average 88.9 total hours broadcast in their careers — five times the US average of 17.3 hours and more than double the GB average of 14.4. Despite this substantially greater time investment, Colombian streamers achieve an average maximum viewer count of 75.4, compared to 145.5 for US streamers who have broadcast far fewer hours. More hours invested is not producing proportionally better outcomes.
The Unknown category — 32,505 streamers who have not disclosed their country — shows the highest average max viewers at 283.8 and average followers at 31,056. This group has been identified in earlier analyses as likely containing a disproportionate concentration of professionally managed or studio-operated accounts. Their performance metrics are consistent with that interpretation: the highest performance, the most deliberate anonymity.
The Experience Paradox: More Sessions, Lower Performance
The most structurally important finding in the geographic data is the inverse relationship between session volume and performance outcomes across countries.
| Country | Avg sessions ever | Avg max viewers | Hours per max viewer |
|---|---|---|---|
| Madagascar | 110.0 | 11.2 | 11.8 |
| Kenya | 79.9 | 20.3 | 1.6 |
| Philippines | 42.7 | 29.4 | 1.6 |
| Ukraine | 41.6 | 142.2 | 2.0 |
| Romania | 32.4 | 91.5 | 2.7 |
| Colombia | 27.0 | 75.4 | 3.3 |
| Australia | 11.9 | 263.2 | 0.05 |
| US | 14.3 | 145.5 | 0.12 |
| GB | 13.2 | 102.0 | 0.14 |
Madagascar streamers average 110.0 historical sessions — the highest in the dataset — yet achieve only 11.2 average maximum viewers. Kenya averages 79.9 sessions and 20.3 maximum viewers. The Philippines averages 42.7 sessions and 29.4 maximum viewers. In each case, more sessions is not producing the viewer accumulation that the session count would suggest.
By contrast, Australian streamers average 11.9 sessions — approximately one-tenth of Madagascar's total — and achieve 263.2 average maximum viewers. US streamers average 14.3 sessions and 145.5 maximum viewers. The per-session efficiency is categorically different.
This pattern cannot be explained by content quality differences alone. It reflects structural advantages — language, infrastructure, purchasing power of the viewer base, algorithmic favorability — that persist regardless of how frequently streamers in lower-performing countries choose to broadcast.
Efficiency Rankings: Which Countries Produce the Most Per Session
Among streamers with at least five historical sessions, the per-session efficiency rankings produce a markedly different ordering than raw performance figures.
| Country | Streamers | Avg max viewers | Avg peak per session | Followers per session |
|---|---|---|---|---|
| New Zealand | 90 | 506.1 | 26.5 | 462.8 |
| Australia | 682 | 376.5 | 20.9 | 590.4 |
| Norway | 49 | 332.6 | 20.0 | 307.5 |
| Unknown | 27,501 | 318.0 | 10.2 | 1,140.2 |
| US | 13,966 | 198.1 | 9.6 | 632.6 |
| Canada | 1,547 | 192.2 | 9.7 | 731.2 |
| Romania | 1,013 | 101.6 | 2.8 | 903.6 |
| Ukraine | 1,142 | 155.0 | 3.4 | 429.7 |
New Zealand's 506.1 average maximum viewers from 90 streamers warrants caution — 90 streamers is a small enough sample that a handful of exceptional accounts can dominate the average. The Australian figure of 376.5 from 682 streamers is more statistically robust and represents the strongest large-sample efficiency in the dataset.
The Unknown category's 1,140.2 followers per session — the highest in the table — suggests that professionally managed accounts are not just achieving higher absolute performance but converting viewers to followers at substantially higher rates per session than any identified country. Whether this reflects content quality, production infrastructure, or strategic follower-acquisition practices is not determinable from the aggregate data.
Romania presents an interesting case: 101.6 average max viewers is modest by western standards, but 903.6 followers per session is among the highest of identified countries. Romanian streamers are converting viewers to followers efficiently despite not achieving large peak audiences. The mechanism behind this conversion efficiency — whether audience composition, content type, or community engagement style — cannot be determined from the current data.
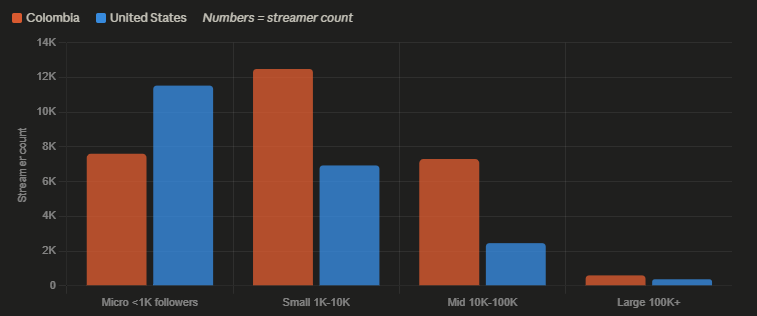
The Structure Within Countries: Colombia's Unusual Distribution
The follower tier analysis reveals that Colombia's streamer population has a fundamentally different maturity structure than any other major country.
| Country | Micro <1K | Small 1K-10K | Mid 10K-100K | Large 100K+ |
|---|---|---|---|---|
| Colombia | 7,603 | 12,480 | 7,295 | 599 |
| US | 11,524 | 6,928 | 2,455 | 376 |
| GB | 1,712 | 765 | 209 | 32 |
| Philippines | 1,669 | 2,046 | 365 | 4 |
| Romania | 279 | 398 | 389 | 80 |
In virtually every country, the micro tier (<1K followers) contains the largest number of streamers — the typical pyramid structure where most participants are at the earliest stage. Colombia is the only major country in this dataset where a middle tier contains more streamers than the micro tier: 12,480 streamers in the 1K–10K range versus 7,603 at micro.
This inverted structure means Colombia has a larger established mid-tier streamer population than most countries have total streamers. The 7,295 mid-tier (10K–100K) Colombian streamers alone outnumber the entire streamer populations of Romania, Venezuela, the Netherlands, and South Africa.
The structural explanation is duration: Colombian streamers average 27.0 historical sessions, reflecting a streaming culture that has been active long enough for a substantial proportion of participants to accumulate past the initial micro-tier threshold. The same pattern appears, even more extremely, in Ukraine (41.6 avg sessions), Romania (32.4), and the Philippines (42.7), all of which show relatively smaller micro-tier proportions.
The US shows the opposite profile: 11,524 micro-tier streamers against 6,928 at the small tier — a steep pyramid that reflects the continuous influx of new entrants. With 76.9% of US streamers classified as having fewer than 20 historical sessions, the US population is the most new-entrant dominated of any large country.
New vs Veteran: The Generational Structure of Streaming Populations
The proportion of streamers with fewer than 20 historical sessions (new) versus those with 100 or more (veteran) reveals how established each country's streaming ecosystem is.
| Country | Total | New % | Veteran % |
|---|---|---|---|
| Kenya | 1,177 | 23.0% | 32.2% |
| Philippines | 4,084 | 31.7% | 7.6% |
| Ukraine | 1,257 | 29.6% | 7.2% |
| Australia | 1,112 | 81.9% | 0.4% |
| Mexico | 722 | 82.5% | 0.4% |
| Germany | 1,946 | 80.6% | 0.6% |
| GB | 2,718 | 80.1% | 0.6% |
| Colombia | 27,977 | 36.6% | 0.9% |
| US | 21,285 | 76.9% | 0.8% |
Kenya's 32.2% veteran rate — the highest of any country in the dataset — combined with only 23.0% new streamers describes a streaming population that has been persistently active over time. Yet despite this experience, Kenyan streamers average only 20.3 maximum viewers. Longevity without performance improvement is the defining pattern.
Australia's 81.9% new-streamer rate — the highest of any major country — combined with 263.2 average max viewers describes the opposite situation: a population dominated by recent entrants who are nonetheless achieving strong performance outcomes quickly. Australian streamers average only 11.9 historical sessions, meaning most of their performance record has been established in very few broadcasts.
This contrast between Kenya and Australia captures the core geographic reality the data establishes throughout this series: session volume and career experience do not translate into performance equivalence across geographies. The structural factors — language, viewer base purchasing power, content-audience fit — that govern per-session outcomes persist regardless of how much time and effort streamers invest.
What Geography Cannot Explain
The geographic data describes aggregate patterns across populations. It does not explain individual outcomes within those populations.
Among Colombian streamers, 599 have accumulated 100K+ followers — a larger absolute number of top-tier streamers than most countries have streamers of any kind. Within any geography, individual performance varies sufficiently that population-level disadvantages do not determine individual outcomes.
What population-level data does establish is the baseline conditions: the structural factors that make viewer acquisition easier or harder for the average streamer from a given origin. A new streamer in Australia starts in conditions where 81.9% of their peers are similarly new, where average max viewers of 263 reflects the potential accessible audience, and where 11.9 average sessions suggests rapid performance discovery. A new streamer in Kenya starts in conditions where 32.2% of their peers have extensive experience, where average max viewers of 20.3 reflects a structurally compressed audience ceiling, and where 79.9 average sessions suggests that persistence has historically not produced proportional results.
Neither starting condition determines outcomes. Both shape the probability distribution of trajectories available from that starting point.
Data sourced from models table reflecting current follower counts, historical session records, and historical maximum viewer data as of April 27, 2026. Country classifications reflect streamer-reported location. New streamer threshold: fewer than 20 historical sessions. Veteran threshold: 100 or more historical sessions.