Heat Burst Anatomy: What Happens During a Platform High-Score Moment
On April 20, the platform recorded 254 heat burst events averaging 435 viewers at the moment of peak. Six days later, 1,126 events were recorded averaging 9,013 viewers each. The scale of the platform's high-intensity moments grew 20-fold in less than a week. The question is what drove it — and what it means for the streamers who triggered it.
The SHS (Sustained Heat Score) algorithm assigns scores to streamers based on viewer momentum, follower growth, and sustained engagement. When a score reaches 90 or above, the system records a milestone event — a moment when a streamer's performance has crossed into genuinely exceptional territory by the platform's measurement. This week we analyzed every milestone event recorded over eight days to understand when these bursts happen, who triggers them, and what content characteristics are associated with the highest-quality burst moments.
The Week's Acceleration Pattern
The daily milestone data reveals a dramatic mid-week acceleration that is the most striking pattern in this week's dataset.
| Date | Milestones | Unique streamers | Avg heat score | Avg viewers at burst | Avg followers |
|---|---|---|---|---|---|
| Apr 20 | 254 | 197 | 97.8 | 435 | 216,211 |
| Apr 21 | 178 | 145 | 97.3 | 573 | 173,058 |
| Apr 22 | 306 | 213 | 97.8 | 1,356 | 243,046 |
| Apr 23 | 849 | 338 | 98.7 | 4,030 | 383,584 |
| Apr 24 | 1,163 | 415 | 98.8 | 5,844 | 372,341 |
| Apr 25 | 1,167 | 351 | 99.0 | 8,450 | 400,594 |
| Apr 26 | 1,126 | 349 | 98.8 | 9,013 | 387,161 |
| Apr 27 | 315 | 122 | 99.1 | 7,339 | 291,752 |
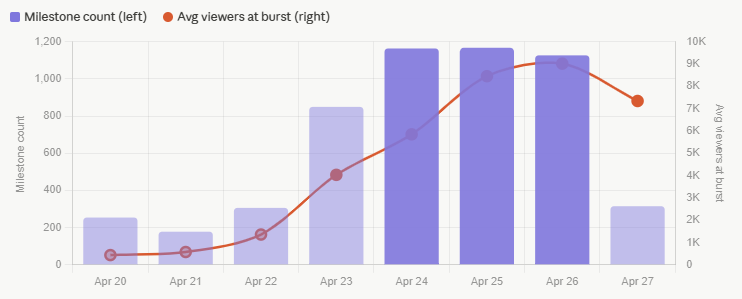
The transition from April 22 to April 23 is the sharpest single-day jump in the dataset: milestone count more than doubled from 306 to 849, and average viewers at burst tripled from 1,356 to 4,030. By April 25–26, both metrics had stabilized at high levels — over 1,100 milestones per day with average burst audiences above 8,000.
April 27 shows a sharp dropoff to 315 milestones and 122 unique streamers. This is consistent with a day-of-week effect: April 27 was a Sunday, when the platform data consistently shows fewer streamers online, which mechanically reduces the number of simultaneous high-score moments.
The follower count column adds important context. Streamers triggering burst events from April 23 onward averaged 370,000–400,000 followers — significantly higher than the 173,000–243,000 of the early-week days. The acceleration in burst frequency from April 23 is not simply more streamers crossing the SHS threshold; it is a different population of streamers, with substantially larger established audiences, entering high-performance territory simultaneously.
When Bursts Happen
The hourly distribution of milestone events challenges the assumption that platform high-intensity moments cluster during conventional prime time.
| Hour (UTC) | Milestones | Unique streamers | Avg heat score | Avg viewers |
|---|---|---|---|---|
| 22:00 | 286 | 129 | 98.8 | 6,435 |
| 05:00 | 275 | 128 | 98.9 | 6,581 |
| 14:00 | 275 | 152 | 98.6 | 4,631 |
| 13:00 | 274 | 151 | 98.5 | 4,576 |
| 21:00 | 264 | 118 | 98.6 | 7,242 |
| 12:00 | 244 | 114 | 98.9 | 5,735 |
| 20:00 | 242 | 121 | 98.5 | 5,993 |
| 03:00 | 239 | 118 | 98.6 | 6,441 |
| 06:00 | 232 | 104 | 99.0 | 7,228 |
| 23:00 | 232 | 105 | 98.5 | 6,575 |
| 19:00 | 232 | 121 | 98.5 | 6,316 |
| 11:00 | 232 | 105 | 98.9 | 6,562 |
The 21:00 UTC slot produces the highest average viewers at burst (7,242), followed by 06:00 UTC (7,228) and 05:00 UTC (6,581). The late-night and early-morning slots — 03:00, 05:00, 06:00 UTC — producing burst audiences of 6,400–7,200 is the most counterintuitive finding in this data.
These hours correspond to late evening in the Americas and early morning in East Asia. The concentration of very high-audience burst events at these unconventional hours suggests that the streamers achieving SHS milestone levels during these windows are operating in lower-competition environments where their audience can concentrate without being distributed across thousands of simultaneous alternatives.
The 14:00 UTC slot — identified as an efficiency peak in earlier platform-wide analyses — shows 4,631 average viewers at burst, substantially lower than the night/early-morning slots. More burst events occur at 14:00, but the individual quality is lower. This is consistent with a window where more streamers are competing for the same viewer attention, making it harder for any individual stream to sustain the concentrated engagement that drives SHS to milestone levels.
The milestone count is relatively flat across hours — ranging from 232 to 286 — suggesting that the number of streamers crossing the SHS threshold does not vary dramatically by time of day. What varies is how large the audience is at the moment of crossing.
The Streamers Who Burst Most Often
The repeat milestone leaderboard reveals two distinct categories of streamer — and one striking outlier.
| Streamer | Milestones | Max heat | Avg viewers at burst | Peak viewers | First burst | Last burst |
|---|---|---|---|---|---|---|
| aviebby | 56 | 100 | 11,770 | 19,341 | Apr 23 17:24 | Apr 26 23:40 |
| loving_ladies | 46 | 100 | 8,373 | 16,123 | Apr 20 21:41 | Apr 26 00:34 |
| pinkypuppa | 35 | 100 | 7,797 | 15,557 | Apr 22 19:53 | Apr 25 04:12 |
| chloe_show | 34 | 100 | 8,317 | 17,042 | Apr 20 15:10 | Apr 26 19:08 |
| ella_lee15 | 32 | 100 | 7,011 | 15,385 | Apr 23 03:32 | Apr 27 06:44 |
| splendid_dolls | 31 | 100 | 7,280 | 17,880 | Apr 20 14:34 | Apr 26 16:28 |
| marry_cordy | 30 | 100 | 9,157 | 17,820 | Apr 23 04:52 | Apr 27 03:48 |
| ellalowe | 30 | 100 | 9,209 | 18,975 | Apr 22 23:44 | Apr 27 03:36 |
| lilkimchii | 24 | 100 | 426 | 943 | Apr 20 09:12 | Apr 27 02:04 |
| ginacali | 24 | 100 | 8,645 | 16,655 | Apr 24 05:16 | Apr 26 09:49 |
aviebby leads with 56 milestone events across four days — roughly 14 per day — with an average of 11,770 viewers at each burst moment and a peak of 19,341. This represents sustained high-intensity performance that is rare in the dataset: not a single exceptional session but a continuous period of audience concentration at very high levels.
The outlier that demands separate analysis is lilkimchii. With 24 milestone events and a maximum heat score of 100, lilkimchii appears to belong to the same category as the other top performers. But the average viewers at burst is 426, and the peak is 943 — approximately 20 times lower than every other entry in the top 20.
This discrepancy reveals something important about the SHS algorithm: it is possible to achieve high heat scores through sustained relative momentum even without a massive absolute audience. lilkimchii's 24 SHS milestones reflect genuine heat score achievements, but they were achieved in a different competitive context — likely a niche time slot or tag environment where the absolute audience is smaller but the relative engagement momentum is still strong enough to cross the threshold.
The lilkimchii case illustrates why milestone count alone is not a sufficient proxy for audience scale. The heat score measures sustained momentum relative to conditions; the absolute audience size it implies depends heavily on those conditions.
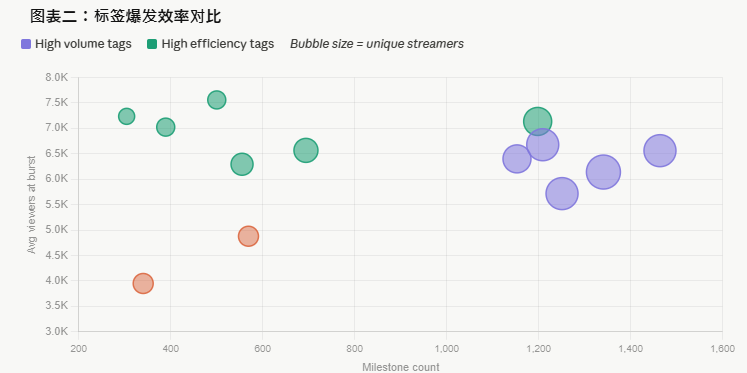
Which Tags Produce the Most — and Best — Burst Moments
The tag analysis separates tags by two distinct dimensions: how frequently streamers using them trigger burst events, and how large the burst audiences are when they do.
| Tag | Milestones | Streamers | Avg viewers at burst | Milestones per streamer |
|---|---|---|---|---|
| shy | 500 | 83 | 7,559 | 6.0 |
| cute | 304 | 62 | 7,236 | 4.9 |
| blonde | 389 | 77 | 7,024 | 5.1 |
| teen | 1,198 | 218 | 7,136 | 5.5 |
| 18 | 1,464 | 275 | 6,561 | 5.3 |
| deepthroat | 340 | 115 | 3,950 | 3.0 |
| cum | 569 | 165 | 4,879 | 3.4 |
| lovense | 1,341 | 291 | 6,141 | 4.6 |
The shy tag produces the highest average viewers at burst of any tag in the dataset at 7,559, from only 83 unique streamers generating 500 total milestones — 6.0 milestones per streamer. The cute tag follows with 7,236 average viewers and 4.9 milestones per streamer from 62 streamers.
These are extremely small populations. 83 streamers using the shy tag triggered burst events this week — a fraction of the thousands using mainstream tags. But when those streamers burst, they do so with larger audiences than streamers using tags with 10–15 times more participants.
The deepthroat tag presents the weakest profile: 340 milestones from 115 streamers (3.0 per streamer) with only 3,950 average viewers at burst — the lowest in the table. Despite being an action-oriented tag with clear content signal, the burst quality is significantly below even the large mainstream tags.
The teen tag shows the best combination of volume and quality: 1,198 milestones from 218 streamers (5.5 per streamer) with 7,136 average viewers at burst. Among the high-volume mainstream tags, teen produces both more bursts per participating streamer and larger audiences at each burst than 18, lovense, bigboobs, squirt, or anal.
What a Burst Event Actually Represents
The SHS milestone system triggers when a streamer crosses a score of 90, which requires sustained high performance across viewer count, momentum, and follower growth simultaneously. A single burst event is not a one-time spike — it reflects a moment where all three components of the score are elevated at once.
The concentration of burst events in specific streamers — aviebby triggering 56 in four days — means these streamers are sustaining that multi-dimensional performance continuously rather than peaking briefly. For a streamer to appear on the milestone leaderboard with 25 or more events in a week, they need to be operating at high audience levels consistently, not just during one exceptional session.
This makes the milestone leaderboard a better indicator of sustained platform performance than any single session metric. A streamer who peaks at 20,000 viewers for ten minutes and then drops to 500 will not accumulate burst events at the rate aviebby or ellalowe are showing. The algorithm is specifically designed to reward sustained elevation rather than momentary spikes.
The practical implication for streamers who want to understand where they stand relative to the platform's high performers: milestone count over a week is a more reliable indicator of genuine performance tier than peak viewer count from any single session.
Data sourced from model_milestones table covering April 20–27, 2026. Milestone events recorded when SHS heat score reached or exceeded 90. Tag analysis uses tags recorded at time of milestone event. Heat score values reflect the SHS algorithm calculation at the moment of recording.