Audience Retention Deep Dive: Which Streaming Formats Hold Viewers the Longest

The session that holds 85% of its peak audience throughout is almost certainly a short one. The session that builds to a peak of 357 viewers started with almost nobody. Both are succeeding — but at completely different things. Understanding which type of session you are running changes how you interpret every metric you track.
Retention — how well a stream holds the viewers it attracts — is one of the most discussed concepts in content strategy and one of the least precisely measured in live streaming. This week's data introduces four distinct audience curve types and maps retention patterns across every gender category and session length. The findings challenge some widely held assumptions about which formats keep viewers engaged.
The Retention Tradeoff by Gender and Session Length
The data this week covers over 600,000 completed sessions across four gender categories and five session length bands. The stability ratio — median viewers divided by peak viewers, expressed as a percentage — is the core retention metric throughout.
| Gender | <30min | 30-60min | 1-2h | 2-4h | 4h+ |
|---|---|---|---|---|---|
| Couple | 47.4% | 44.7% | 42.2% | 35.7% | 31.0% |
| Female | 59.1% | 61.2% | 55.8% | 48.5% | 45.2% |
| Male | 60.8% | 61.4% | 57.5% | 51.4% | 45.8% |
| Trans | 63.2% | 59.2% | 53.9% | 47.4% | 37.7% |
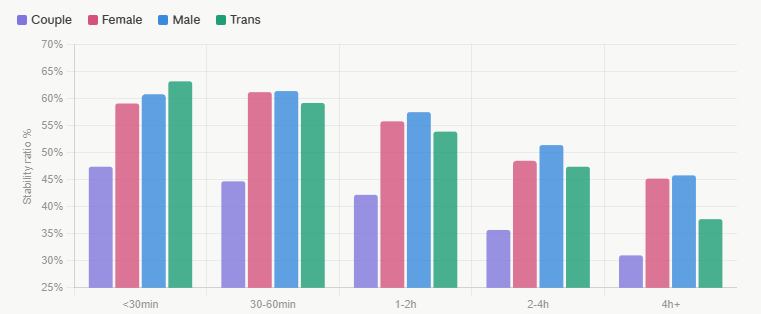
Three patterns stand out immediately.
Trans streamers achieve the highest stability ratio of any group for short sessions at 63.2%, but also show the steepest decline — falling to 37.7% for sessions over four hours, a 25.5 percentage point drop. This is the sharpest session-length penalty in the dataset. Trans content may attract highly intent-driven viewers who engage deeply in short bursts but do not sustain attention across extended broadcasts.
Female and male streamers show a similar profile: modest peaks at 30–60 minutes (61.2% and 61.4% respectively), followed by steady decline. The pattern suggests a sweet spot in the 30–60 minute range where viewers have arrived and settled but the session has not yet run long enough for natural audience cycling to erode the retention ratio.
Couple streamers show the lowest retention across every session length — starting at 47.4% for short sessions and declining to 31.0% for sessions over four hours. This appears to contradict the strong audience quality metrics documented in earlier analyses. The resolution is that couple sessions attract larger absolute audiences at peak, but those peaks are driven partly by browse-in curiosity that converts to stays at a lower rate than other categories. The audience is large; the proportion that stays is smaller.
The Best Times to Stream for Retention
The timing data focuses on sessions where median audience exceeded 10 viewers — eliminating very small sessions where retention metrics become noisy.
| Start hour (UTC) | Sessions | Avg median | Stability | Avg/median ratio |
|---|---|---|---|---|
| 15:00 | 8,108 | 82.0 | 53.4% | 97.0% |
| 23:00 | 6,654 | 78.3 | 51.1% | 99.2% |
| 14:00 | 8,276 | 70.1 | 50.9% | 100.6% |
| 12:00 | 8,692 | 77.9 | 50.3% | 99.2% |
| 13:00 | 8,871 | 74.0 | 49.6% | 101.4% |
| 17:00 | 7,560 | 82.6 | 48.9% | 101.4% |
| 00:00 | 6,622 | 80.4 | 48.9% | 99.5% |
| 19:00 | 10,145 | 70.8 | 48.0% | 98.4% |
The 15:00 UTC slot produces both the highest stability ratio (53.4%) and the second-highest median audience (82.0) of any hour in the dataset. This is consistent with the platform-wide efficiency peak documented in earlier timing analyses: 15:00 UTC corresponds to the afternoon overlap window when European audiences and US morning audiences are simultaneously accessible, producing both high viewer counts and viewers who have time to stay.
The 19:00 UTC slot — the most popular broadcast hour by session count at 10,145 — achieves only 48.0% stability despite its volume advantage. More streamers broadcasting at 19:00 means more competition for viewer attention, which likely contributes to higher viewer cycling and lower retention per session.
The avg/median ratio column reveals something the stability figure alone cannot: whether audiences are still growing or already declining when the median measurement is taken. Values above 100% indicate the average was higher than the median — meaning the audience grew after the median point, or the low-audience periods (typically session opening and closing) pushed the median below the overall average. The 13:00, 16:00, and 20:00 slots all show ratios above 101%, suggesting these sessions tend to build audience as they progress.
Four Types of Audience Curve
The relationship between avg_users and median_users classifies sessions into four behavioral profiles that reveal how viewer engagement changes across the arc of a broadcast.
| Curve type | Sessions | Avg median | Avg peak | Avg hours | Stability |
|---|---|---|---|---|---|
| Fast decay (avg/median <70%) | 2,802 | 161.5 | 188.8 | 0.7 | 85.5% |
| Mild drop (70–90%) | 94,125 | 55.1 | 73.7 | 2.0 | 74.8% |
| Stable (90–110%) | 183,740 | 37.7 | 64.5 | 3.0 | 58.4% |
| Late builder (avg > median) | 33,301 | 59.9 | 357.3 | 3.1 | 16.8% |
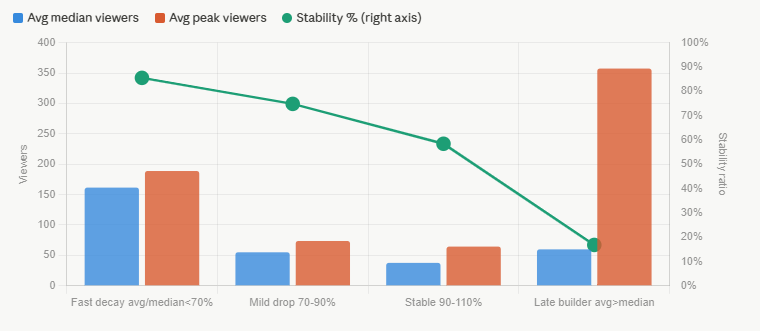
The late-builder type produces the most striking number in this week's data: an average peak of 357.3 viewers against a median of 59.9. This means these sessions, at their peak moment, were attracting six times the audience that the typical measurement captured. The stability ratio of 16.8% confirms the extreme: only a fraction of peak viewers remain at the median measurement point.
This profile describes sessions that start quietly, grow substantially during the broadcast — perhaps through algorithmic promotion that fires mid-session or a content moment that triggers external sharing — and reach their maximum audience well after the session's midpoint. The average session length of 3.1 hours suggests these are not brief broadcasts that happened to spike; they are extended sessions whose growth arc plays out over hours.
The fast-decay type sits at the opposite extreme: 85.5% stability, meaning audiences who arrive at peak stay for most of the session. But these sessions average only 0.7 hours in length — short broadcasts where there is simply less time for audience to cycle out. The high median of 161.5 with a peak of only 188.8 suggests audiences that arrived quickly and in full — likely direct subscriber notifications rather than browse-driven discovery.
The stable type — 183,740 sessions, the largest category — represents the platform's default viewing pattern: audiences that arrive, plateau at some level, and gradually thin as the session extends. The 58.4% stability and 3.0-hour average length describes a sustained broadcast where roughly 60% of peak viewers are present at any given moment across the session.
The High-Retention Performers
Among streamers running at least three sessions with median audiences above 50 and average stability above 80%, a distinctive behavioral profile emerges.
| Streamer | Sessions | Avg median | Avg stability | Worst stability | Avg hours |
|---|---|---|---|---|---|
| honeyyykate | 3 | 17,170 | 88.7% | 59.6% | 5.7 |
| squikt | 3 | 16,260 | 88.3% | 70.8% | 4.5 |
| karinaaaxx | 4 | 14,407 | 92.0% | 9.2% | 4.8 |
| cumplaycouple | 4 | 12,830 | 91.3% | 18.5% | 1.7 |
| emyii | 4 | 9,411 | 92.8% | 16.8% | 2.9 |
| littlee33 | 4 | 10,535 | 91.3% | 11.4% | 2.9 |
| sweet_littleee | 3 | 8,497 | 90.6% | 1.3% | 2.5 |
The worst-stability column is the most instructive. karinaaaxx averages 92.0% stability across four sessions but has a worst-session figure of 9.2% — meaning at least one session involved a massive peak that the audience immediately departed. The average stability is high because the other sessions were genuinely stable; the worst-session outlier likely reflects an algorithmic push that attracted a large transient audience.
cumplaycouple at 91.3% average stability with a worst session of 18.5% shows a more consistent profile — no single session collapsed dramatically. The 1.7-hour average session length keeps each broadcast short enough that audience cycling has less time to erode retention.
emyii at 92.8% average stability with a worst session of 16.8% and 2.9-hour sessions is the most operationally demanding of these profiles: high stability maintained across four sessions of nearly three hours each, at median audiences above 9,000. This represents genuinely exceptional audience relationship quality — viewers who arrive at these sessions and stay for the duration, repeatedly, across multiple broadcasts.
What the Retention Data Cannot Tell You
The stability ratio measures what proportion of peak viewers are present at the typical measurement moment. It does not measure whether individual viewers are paying attention, engaging with the content, or likely to return for future sessions.
A session with 80% stability could reflect deeply engaged viewers who never leave, or a large audience of mostly passive background viewers who happen to leave the tab open. The metric captures presence, not engagement quality. The distinction matters for follow-on outcomes like follower conversion and return visit rates, which the current dataset cannot directly measure.
The avg/median ratio used for the audience curve classification also has a limitation: it compares two aggregate statistics rather than tracking individual viewer journeys. A session where 1,000 viewers arrive, 500 leave, and 500 new viewers join would look identical to one where the same 1,000 viewers stayed throughout — both might show similar avg/median ratios despite representing fundamentally different audience relationships.
These limitations do not invalidate the retention framework. They establish its appropriate scope: the stability ratio and audience curve type are useful indicators of session-level audience dynamics, useful for comparing sessions and streamers at scale, but insufficient for understanding individual viewer behavior.
Data sourced from real-time platform analytics covering April 17–24, 2026. Retention analysis restricted to completed sessions with median_users, peak_users, and avg_users all recorded. Timing analysis restricted to sessions where median_users exceeded 10 to reduce noise from very small audiences. High-retention performer list requires at least three sessions with median_users above 50 and average stability ratio at or above 80% during the measurement period.