The Competitive Moat: Which Streamer Characteristics Are Hardest to Replicate

After nine weeks of analysis, one finding stands out above all others: stability ratio — the metric we assumed separated top performers from the rest — is nearly identical across every performance tier. The real moats are elsewhere. And they are harder to build than any tactical adjustment.
This is the tenth installment in a series that has examined platform supply-demand dynamics, session frequency, category scarcity, geographic effects, follower growth, session quality, timing, and audience retention. Each analysis produced findings that challenged conventional wisdom in some way. This final piece attempts to synthesize what the data across all ten weeks actually says about which advantages are durable and which are tactical.
The answer is less comfortable than most strategy discussions acknowledge.
The Finding That Reframes Everything
The most important result in this week's data is not about the top performers. It is about what does not differentiate them from everyone else.
| Performance tier | Streamers | Avg median | Avg stability | Weekly hours | Sessions/week |
|---|---|---|---|---|---|
| Top (500+ median) | 532 | 1,050.2 | 56.0% | 14.9 | 4.1 |
| High (100–500) | 2,883 | 203.6 | 56.9% | 17.4 | 5.3 |
| Mid (20–100) | 11,896 | 40.8 | 56.4% | 17.4 | 5.9 |
| Entry (<20) | 69,039 | 6.7 | 56.1% | 15.2 | 7.5 |
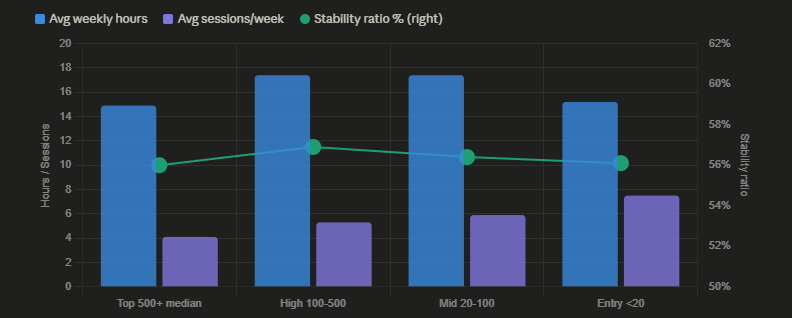
The stability ratio across these four tiers is 56.0%, 56.9%, 56.4%, and 56.1%. These numbers are not approximately similar — they are essentially identical. A top-tier streamer with a median audience of 1,050 holds the same proportion of their peak audience as an entry-level streamer with a median audience of 6.7.
This overturns a conclusion that several earlier analyses in this series implied: that stability ratio is a differentiating characteristic of high-performing streamers. At the level of within-session retention, the data does not support this. The top tier is not retaining a larger share of its peak audience. It is simply attracting a much larger peak in the first place.
The implication is significant. Within-session audience loyalty — the metric that intuitively seems like it should reflect content quality — does not appear to be what separates performance levels. Something else does.
What Actually Separates the Tiers
If stability ratio does not explain the gap between top and entry-tier streamers, the more useful question is what does.
Session frequency is the most visible behavioral difference. Top-tier streamers average 4.1 sessions per week. Entry-tier streamers average 7.5 — nearly double. The total weekly hours are similar: 14.9 for top-tier, 15.2 for entry-tier. Top-tier streamers concentrate their time into fewer, longer sessions. Entry-tier streamers spread the same hours across more frequent, shorter sessions.
This pattern has appeared repeatedly throughout this series. More sessions does not produce better outcomes. Top performers have not discovered this and adjusted — or they have, and the adjustment is reflected in their session counts.
Absolute audience scale is the other visible difference — and it is far more stark than the frequency gap. The median audience of the top tier (1,050.2) is 157 times larger than the entry tier (6.7). This is not a gradient; it is a discontinuity. The mid tier (40.8) sits closer to the entry tier than to the high tier, and the high tier (203.6) sits closer to the mid tier than to the top.
The distribution is a power law. Most streamers are in the entry tier. The top tier is vanishingly small — 532 streamers out of a population of 84,350 in this week's analysis, representing 0.6%.
The Most Durable Moat: Accumulated Audience
The follower data makes the compounding dynamic explicit.
| Follower tier | Streamers | Avg followers | Avg max viewers ever | Avg total hours ever |
|---|---|---|---|---|
| Micro (<5K) | 69,354 | 1,196 | 26.9 | 36.8 |
| Small (5K–20K) | 20,910 | 10,270 | 75.0 | 72.7 |
| Mid (20K–100K) | 12,241 | 43,557 | 220.2 | 75.6 |
| Large (100K+) | 3,667 | 268,709 | 1,309.9 | 71.5 |
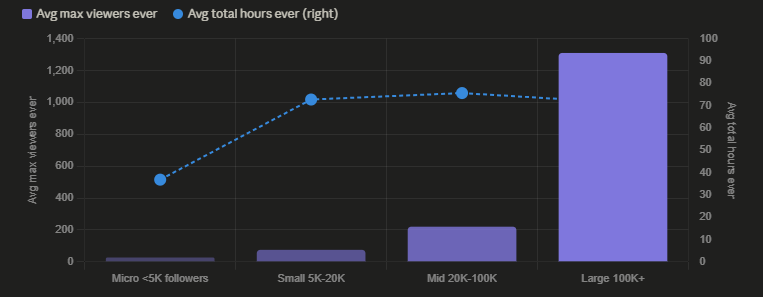
Large-tier streamers have achieved a historical maximum of 1,309.9 concurrent viewers. Micro-tier streamers have achieved 26.9. The ratio is 49 to one.
What makes this striking is the hours column. Mid, small, and large-tier streamers have all accumulated roughly 71–76 hours of total historical broadcast time — nearly identical. Micro-tier streamers have accumulated only 36.8 hours, roughly half. The large-tier advantage in max viewers is not primarily a function of streaming more hours. It reflects a different baseline from which each broadcast starts.
A large-tier streamer going live starts with hundreds of subscribers who receive notifications and choose to tune in. A micro-tier streamer going live starts from near zero, dependent on platform discovery for every viewer. The accumulated follower base is not just a number — it is infrastructure for future sessions. Every session for a large-tier streamer is partly pre-loaded with an audience that micro-tier streamers must acquire from scratch each time.
This is the most structurally durable advantage in the dataset because it is self-reinforcing and time-dependent. A micro-tier streamer cannot replicate the large-tier advantage through strategic choices in the next week or month. The accumulation requires time, and the compounding accelerates as the base grows.
The Consistency Moat: What the Repeat Performers Show
The second-hardest characteristic to replicate is not peak performance but consistent above-floor performance across many sessions.
| Streamer | Sessions | Min median | Max median | Avg median | Stability | Total hours |
|---|---|---|---|---|---|---|
| louie_cute_asian | 27 | 107 | 260 | 152.5 | 72.1% | 75.2 |
| sililis | 26 | 100 | 290 | 154.7 | 68.1% | 25.4 |
| libbyshepard | 24 | 426 | 2,238 | 993.9 | 74.0% | 87.6 |
| shiny_lily | 23 | 120 | 316 | 189.2 | 74.6% | 132.3 |
| sweetyoops | 22 | 109 | 277 | 167.1 | 60.2% | 88.7 |
| bratzdoll1994 | 22 | 101 | 190 | 142.9 | 75.2% | 83.6 |
| kira0541 | 21 | 107 | 379 | 196.5 | 63.3% | 104.7 |
| julcy_peach | 20 | 144 | 904 | 327.9 | 68.4% | 118.5 |
| alice69foxy | 17 | 191 | 423 | 331.9 | 80.2% | 45.3 |
The defining characteristic of these streamers is not the height of their best session. It is the floor of their worst one. louie_cute_asian ran 27 sessions this week — more than three per day on average — and never once dropped below 107 median viewers. sililis ran 26 sessions and never dropped below 100. bratzdoll1994 ran 22 sessions with a minimum of 101 and a maximum of only 190 — an unusually narrow range suggesting a highly stable, repeat-visiting audience rather than one driven by algorithmic surfacing events.
This consistency is harder to achieve than a single exceptional session. Any streamer can have one extraordinary session driven by an algorithmic push, a social media moment, or a fortunate timing coincidence. Having 20 consecutive sessions all above 100 median viewers requires an audience that returns reliably, independent of external factors. That audience relationship is built over time and cannot be manufactured through tactical changes.
libbyshepard presents a different consistency profile: 24 sessions with a minimum of 426 and a maximum of 2,238 — a 5x range, much wider than bratzdoll1994's 1.9x. The floor is higher and the ceiling is much higher, but the performance is less predictable. Both profiles represent durable advantages; they represent different types of audience relationships.
What Tactical Changes Can and Cannot Achieve
Across ten weeks of analysis, the series has documented several tactical variables that affect outcomes. It is worth being precise about which of these represent genuine moats versus adjustable parameters.
Adjustable through strategy:
Session timing — moving from 23:00 UTC to 10:00 UTC improves viewers-per-model ratios. This is real but modest in absolute terms and self-correcting if many streamers adopt the same timing.
Tag selection — choosing less saturated tags improves per-streamer audience access. This advantage erodes as other streamers read the same data and make the same adjustments.
Session frequency — reducing from 7.5 to 4.1 sessions per week is associated with better outcomes. This is achievable immediately and does not require audience development.
Session length — the relationship between session length and retention ratio is real but represents a tradeoff, not a free optimization.
Not achievable through tactical adjustment:
Follower base size — accumulated over months or years, requiring consistent performance and time. The compounding advantage of a 100K+ follower base cannot be replicated by a micro-tier streamer in any reasonable timeframe through strategy changes alone.
Geographic origin — a streamer's country of origin affects baseline performance through infrastructure, language, and algorithmic factors. This is a fixed characteristic.
Historical performance record — the consistency data shows that streamers with 20+ sessions all above 100 median viewers have demonstrated reliability that no amount of single-session optimization can replicate.
Category characteristics — couple content's inherent draw advantage, documented in week three, is not available to solo streamers regardless of strategic decisions.
The Uncomfortable Arithmetic
The platform-wide data from this week's analysis contains a number that puts the tactical discussion in perspective.
There are 69,039 entry-tier streamers in this week's analysis — those with median audiences below 20. There are 532 top-tier streamers with median audiences above 500. The ratio is 130 to one.
The entry-tier streamers are not performing worse than the top tier because they have made inferior strategic choices about timing, tags, or session frequency. The performance gap is 157 times. No combination of tactical optimizations produces a 157x improvement. The gap reflects the accumulated advantage of follower base, historical audience development, and the compounding effect of consistent above-average performance over time.
This does not mean tactical choices are irrelevant. For two streamers at similar stages of development, better timing, tag selection, and session structure can meaningfully differentiate outcomes. The earlier analyses in this series document real effects that are real advantages for those who apply them.
What the data does not support is the conclusion that tactical optimization is sufficient to bridge the structural gap between tiers. The moats that matter most — accumulated audience, demonstrated consistency, and the compounding dynamic of the follower base — are built through sustained performance over time, not through any strategic insight available in a single week's data.
A Note on What This Series Has and Has Not Established
This series has analyzed ten weeks of platform data from a system that has been operational for approximately three weeks at the time of the first analysis. The findings are patterns observed in cross-sectional data — snapshots of performance at a point in time — rather than longitudinal tracking of individual streamers over extended periods.
Several conclusions that would strengthen the practical value of this analysis remain out of reach. Whether high-retention streamers accumulate followers faster over time than spike-driven streamers cannot be established from one week's data. Whether the tactical timing and tag advantages documented here persist as more streamers adopt them cannot be predicted from current patterns. Whether the consistency moat shown in week-ten data reflects durable audience relationships or temporary clustering of favorable sessions requires months of follow-up data to determine.
What the series has established with reasonable confidence is the structure of the competitive landscape at this point in time: who is competing, on what terms, with what distribution of outcomes, and which characteristics are associated with which performance levels. The causes behind these associations remain substantially uncertain.
The most honest summary of ten weeks of analysis is this: the platform rewards accumulated audience above all else, the distribution of outcomes is more unequal than intuition suggests, and the characteristics most associated with top performance are the ones least accessible to streamers just starting out. Tactical improvements are real and worth pursuing. They operate within a structural reality that tactics alone cannot change.
Data sourced from real-time platform analytics. Performance tier analysis covers 84,350 streamers with at least two completed sessions during April 16–23, 2026. Follower tier analysis from models table reflecting current follower counts and historical maximums. Consistency analysis restricted to streamers with at least three sessions all meeting the 100 median viewers threshold during the measurement period.