The Retention Curve: How Audience Decay Patterns Predict Long-Term Streamer Trajectories

Two streamers. Same follower count. One broadcasts six hours per week and holds 77% of their peak audience throughout every session. The other broadcasts sixteen hours and loses 69% of their peak within the first quarter of each session. The data cannot tell us who will be larger in six months. But it can tell us which one is building something that compounds.
The stability ratio — median viewers divided by peak viewers — has appeared throughout this series as a secondary metric, something to note alongside the more intuitive numbers like follower count and peak audience. This week we put it at the center of the analysis. The findings suggest it encodes more information about audience behavior than any other single metric available in this dataset.
The Retention Tradeoff: Length vs Loyalty
The first pattern in this week's data involves a relationship that most advice about session length ignores: as sessions get longer, audiences grow in absolute size but shrink as a proportion of peak.
| Session length | Sessions | Avg median | Avg peak | Stability ratio | Avg P90 |
|---|---|---|---|---|---|
| Under 30 min | 125,932 | 4.9 | 7.9 | 62.2% | 7.6 |
| 30–60 min | 113,673 | 9.2 | 15.0 | 61.0% | 14.0 |
| 1–2 hours | 150,325 | 15.7 | 27.6 | 57.0% | 24.4 |
| 2–4 hours | 139,077 | 27.8 | 51.2 | 54.2% | 43.1 |
| 4–8 hours | 98,542 | 33.7 | 65.7 | 51.3% | 52.4 |
| 8+ hours | 7,487 | 41.7 | 84.1 | 49.6% | 64.7 |
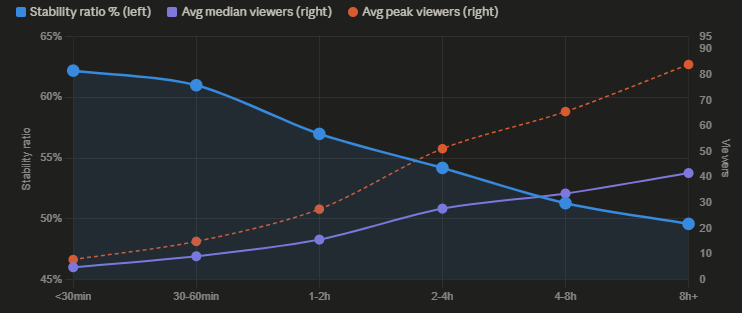
The pattern is monotonically consistent. Every step up in session length produces a higher median audience in absolute terms and a lower stability ratio. A session under 30 minutes retains 62.2% of its peak audience as its median — more than three-fifths of viewers who arrive at peak are still present at the typical measurement. A marathon session of eight or more hours retains only 49.6%.
This is not surprising in isolation: longer sessions give more time for initial viewers to leave and be replaced by later arrivals, creating natural variation that depresses the median relative to peak. What the data makes precise is the scale of this tradeoff. A streamer adding two hours to a typical 1–2 hour session can expect their median audience to increase from 15.7 to 27.8 — a 77% gain in absolute terms — while their retention ratio falls from 57.0% to 54.2%, a 2.8 percentage point reduction.
Whether that tradeoff is favorable depends on what the streamer is optimizing for. Absolute audience size favors longer sessions. Audience loyalty metrics favor shorter ones. Neither objective is inherently superior, but they are genuinely different targets requiring different strategies.
Four Types of Audience Curve
The relationship between avg_users and median_users within a session captures something the stability ratio alone cannot: the shape of audience movement across the session's arc.
When avg_users is substantially below median_users, the session had significant low-audience periods that pulled the average down — typically corresponding to opening and closing segments where viewers have not yet arrived or have already left. When avg_users exceeds median_users, the audience was still growing at the point of peak measurement, suggesting a session that built momentum rather than one that peaked early and declined.
| Audience curve type | Sessions | Avg median | Avg peak | Avg hours |
|---|---|---|---|---|
| Sharp drop (avg/median <70%) | 55,781 | 3.0 | 4.3 | 1.5 |
| Mild drop (70–90%) | 137,610 | 20.3 | 29.0 | 2.0 |
| Stable (90–110%) | 352,253 | 20.6 | 36.2 | 2.4 |
| Late builder (avg > median) | 46,767 | 28.2 | 87.5 | 2.6 |
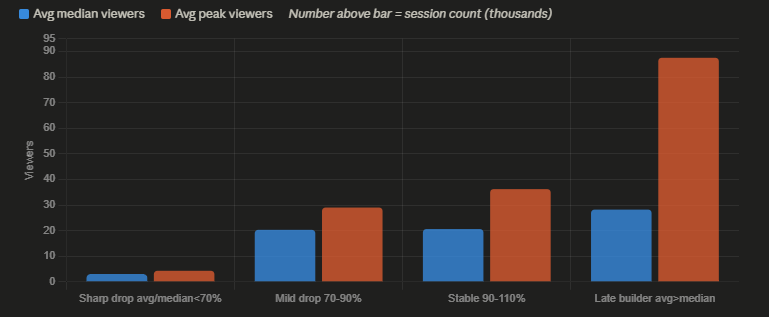
The late-builder type is the most analytically interesting. These sessions — 46,767 of them this week, roughly 8% of all completed sessions — have average audiences that exceed their median audiences. This means the typical viewer measurement during the session was lower than the overall average, which only occurs when audience size was still rising at the point when the median was being calculated and continued growing afterwards.
The peak figure for late-builder sessions is 87.5 — dramatically higher than the 36.2 peak for stable sessions and the 29.0 for mild-drop sessions, despite similar median audiences of 20–28. These are sessions that start quietly, build momentum, and reach their peak late — the opposite of the more common profile where a stream peaks early through algorithmic surfacing and then gradually loses viewers as the session continues.
The sharp-drop type — 55,781 sessions with avg/median ratios below 70% — shows the worst performance across every metric: 3.0 median, 4.3 peak, 1.5 hours. These are sessions that likely never found their audience, generating low engagement throughout and ending before the streamer could establish any viewer base.
Same Starting Point, Different Strategies
The most directly comparable data in this week's analysis involves two groups of streamers with nearly identical follower bases pursuing fundamentally different approaches.
| Group | Streamers | Avg median | Avg peak | Stability | Total hours/week | Avg followers |
|---|---|---|---|---|---|---|
| High retention (70%+) | 8,443 | 30.7 | 41.1 | 76.9% | 6.2 | 18,295 |
| Spike-driven (<40%) | 6,518 | 24.7 | 76.5 | 31.2% | 16.0 | 18,140 |
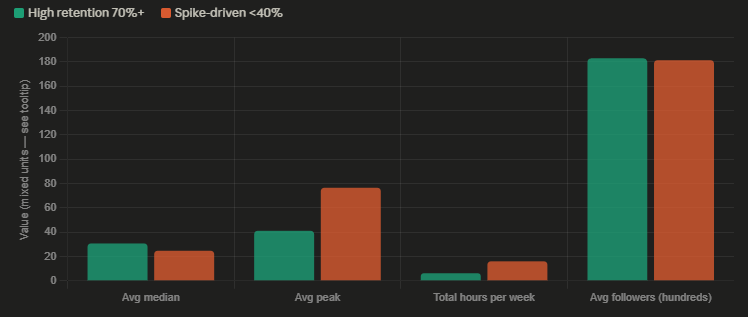
The follower count difference between these two groups — 18,295 versus 18,140 — is negligible. These are not different tiers of streamers; they are streamers at the same developmental stage who have arrived at opposite strategic positions.
The contrast in behavior is stark. High-retention streamers broadcast an average of 6.2 hours per week across multiple sessions, holding 76.9% of their peak audience as their median. Spike-driven streamers broadcast 16.0 hours — more than two and a half times as many — achieving peak audiences of 76.5 that far exceed the high-retention group's 41.1, while retaining only 31.2% of that peak as their median audience of 24.7.
The spike-driven group achieves better raw peak numbers through substantially more time investment. The high-retention group achieves better median retention in roughly one-third the broadcast hours.
One important limitation applies here: this comparison reflects a single week's data. Streamer behavior may not be consistent week to week, and what appears as a strategic difference could partly reflect circumstances — an unusually good or bad week for either group. The follower count similarity is reassuring as a control, but the analysis cannot establish which approach leads to better outcomes over time without longitudinal data the current system does not yet have.
The Compounding Logic of Retention
Why does retention ratio matter beyond its face value as a measure of audience loyalty? The answer lies in how follower conversion likely works — though the data available here cannot confirm the mechanism directly.
A viewer who arrives at a stream and leaves within three minutes has low probability of following. A viewer who stays for thirty minutes, engages with the content, and is still present when the streamer closes the session has substantially higher probability. The stability ratio is an imperfect proxy for the proportion of viewers experiencing the latter rather than the former.
If this logic holds, high-retention streamers should convert a higher proportion of viewers to followers per session than spike-driven streamers. Over time, with comparable peak audience numbers, the high-retention streamer would accumulate followers faster despite similar or lower peak counts.
The follower count data in this week's analysis does not confirm this — both groups have similar average follower counts, which could reflect similar historical performance or simply that the comparison captures a cross-section rather than a trajectory. Confirming the compounding hypothesis would require tracking the same streamers across multiple weeks, which the current data window does not permit.
What the data does establish is that two demonstrably different strategies — retention-focused and spike-focused — can produce similar follower accumulations, at least at this point in time.
The High-Retention Profile Across Follower Tiers
The high-retention group — streamers maintaining stability ratios above 75% across at least two sessions — shows consistent characteristics across follower tiers.
| Follower tier | Streamers | Avg median | Avg stability | Avg session hours | Avg sessions/week |
|---|---|---|---|---|---|
| Micro (<5K) | 3,276 | 8.7 | 82.9% | 0.7h | 3.7 |
| Small (5K–20K) | 415 | 23.3 | 79.4% | 1.4h | 5.0 |
| Mid (20K–100K) | 227 | 88.9 | 79.1% | 2.2h | 4.6 |
| Large (100K+) | 113 | 439.6 | 79.0% | 2.8h | 3.6 |
The stability ratio is remarkably consistent across tiers — 82.9% at micro, declining only slightly to 79.0% at large. This suggests that high retention is a behavioral characteristic that persists as streamers grow, not something that naturally emerges at a certain audience size. Streamers who retain audiences well at the micro level appear to continue doing so as their audiences expand.
The session length pattern is equally notable. Micro-tier high-retention streamers average only 0.7 hours per session — very short broadcasts that maintain high engagement throughout. As streamers grow, session length increases gradually, reaching 2.8 hours at the large tier. The sessions get longer as audiences develop, but the retention characteristic is maintained.
This is consistent with an interpretation where session length is determined partly by what the audience can sustain. A small, highly engaged audience may not exist in sufficient numbers to keep a stream active for three hours; a large, loyal audience can. The session length grows with audience development rather than being imposed as a fixed strategy.
What the Retention Curve Cannot Tell You
Retention ratio as measured here — median divided by peak — is an approximation of audience loyalty within a single session. It does not measure return visit rate, which is arguably the more important loyalty metric: whether viewers who attended one session chose to come back for the next.
A streamer with a high within-session retention ratio but low return rates — viewers who stay through one session but never return — would appear favorable by this metric but might be accumulating little durable audience. Conversely, a streamer with more variable within-session retention but high return rates could be building a more loyal audience than the ratio suggests.
The avg_users field used in the audience curve analysis also has a subtle limitation: it represents the average of periodic measurements rather than a true continuous average across the session. If measurements are taken at fixed intervals, the average may not accurately represent total viewing time if audience levels change rapidly between measurement points.
These limitations do not invalidate the analysis, but they define its scope. Retention ratio is a useful indicator of within-session audience behavior — one of several signals that together describe how a streamer is connecting with their audience. No single metric is sufficient.
The Practical Frame
Across eight weeks of analysis in this series, several consistent patterns have emerged. Streamers who broadcast less frequently achieve better per-session quality. Streamers who choose less saturated tags operate with more favorable competitive ratios. Streamers who broadcast during low-competition hours achieve better viewer density. And streamers who maintain higher retention ratios in shorter sessions appear to achieve similar follower accumulation with substantially less time investment.
These patterns are not independent — they reinforce each other. A shorter, well-timed session in a less competitive tag, with content that holds audience throughout rather than spiking early and decaying, represents the convergence of every efficiency insight this series has documented.
Whether this convergence describes a deliberate strategy or an emergent characteristic of streamers who have found what works is a question the cross-sectional data cannot answer. What is clear is that the combination exists, it is measurable, and the streamers exhibiting it are achieving meaningful results at a fraction of the time investment of their less efficient peers.
Data sourced from real-time platform analytics covering April 14–21, 2026. Stability ratio calculated as median_users divided by peak_users per session, averaged across sessions for multi-session streamers. Audience curve type classification based on the ratio of avg_users to median_users within completed sessions. High-retention group defined as streamers with average stability ratio at or above 75% across at least two sessions in the measurement period.