The Platform Clock: When Viewers Are Actually Watching, and What That Means for Strategy
The hour with the most viewers online is not the best hour to stream. The day with the most total viewing minutes is not the best day. The metric that matters is not volume — it is the ratio of viewers to the number of streamers competing for them at any given moment.
Most timing advice in live streaming focuses on when audiences are largest. Stream during peak hours, the conventional wisdom says, because that is when the most people are watching. The data suggests this framing optimizes for the wrong thing. A larger audience distributed across dramatically more streamers produces worse outcomes for any individual streamer than a smaller audience distributed across fewer competitors.
This week we mapped viewer density — not viewer volume — across every hour and every day of the week. The results challenge several widely held assumptions about when to broadcast.
The Hour That Looks Wrong But Is Right
The most important finding in this week's platform data involves a counterintuitive relationship between total viewers, total streamers, and per-streamer audience density.
| Hour (UTC) | Streamers online | Total viewers | Viewers per model | Peak viewers |
|---|---|---|---|---|
| 10:00 | 5,896 | 185,754 | 31.50 | 3,022 |
| 11:00 | 5,921 | 188,730 | 31.88 | 3,093 |
| 20:00 | 8,846 | 269,830 | 30.50 | 5,909 |
| 21:00 | 9,000 | 281,659 | 31.30 | 5,250 |
| 22:00 | 8,996 | 268,700 | 29.87 | 5,306 |
| 01:00 | 8,013 | 199,330 | 24.87 | 3,888 |
| 02:00 | 7,387 | 197,311 | 26.71 | 3,590 |
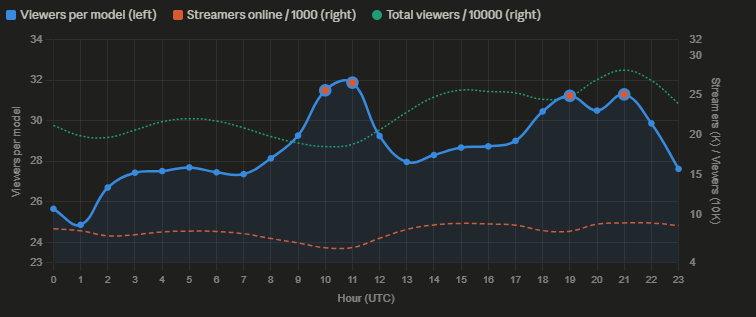
The 10:00–11:00 UTC window — corresponding to early morning on the US East Coast, mid-morning in Europe — produces the highest viewers-per-model ratios of any hour in the day at 31.50 and 31.88. At these hours, fewer than 6,000 streamers are online competing for approximately 186,000–189,000 total viewers.
By contrast, 20:00–21:00 UTC — the conventional prime-time window that most streamers target — has more total viewers (270,000–282,000) but also the most streamers (8,846–9,000). The per-model density at 20:00 is 30.50, lower than the 10:00 figure despite 84,000 more total viewers being on the platform.
The 21:00 UTC figure of 31.30 is comparable to the 10:00–11:00 window, making late evening competitive with mid-morning as an efficiency window. But 01:00–02:00 UTC, which many streamers treat as a viable late-night option, produces the worst density of the day at 24.87–26.71 — more than five points below the efficiency leaders.
The practical implication is that a streamer choosing between a 10:00 UTC start and a 20:00 UTC start based on total viewer volume would choose 20:00. A streamer choosing based on per-streamer viewer density would choose 10:00 — and the efficiency advantage is meaningful even though the absolute audience counts are lower.
The Day-of-Week Effect Is Larger Than Most Realize
The weekly data reveals a pattern that is both more pronounced and more structurally interesting than hourly variation.
| Day | Streamers | Total viewers | Viewers per model |
|---|---|---|---|
| Sunday | 6,682 | 236,807 | 35.44 |
| Monday | 7,272 | 222,021 | 30.53 |
| Tuesday | 8,240 | 220,530 | 26.76 |
| Wednesday | 8,478 | 220,020 | 25.95 |
| Thursday | 8,044 | 221,773 | 27.57 |
| Friday | 8,388 | 231,891 | 27.64 |
| Saturday | 8,188 | 236,752 | 28.92 |
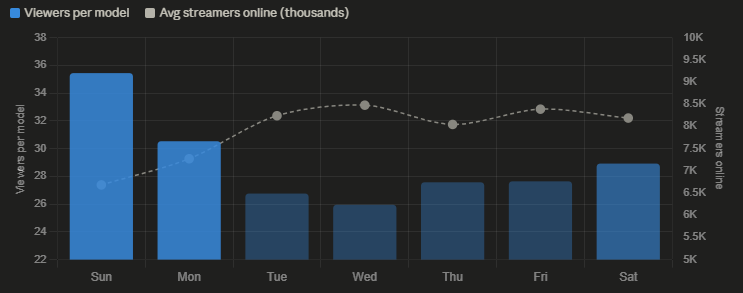
Sunday's viewers-per-model figure of 35.44 is 37% higher than Wednesday's 25.95. This gap is not driven by dramatically different total viewer counts — Sunday's 236,807 and Wednesday's 220,020 differ by less than 8%. The gap is driven almost entirely by streamer count: 6,682 streamers on Sunday versus 8,478 on Wednesday.
Fewer streamers are willing to broadcast on Sundays, apparently assuming that is a low-traffic day. Viewer demand, however, does not follow the same schedule. The result is a structural inefficiency that creates opportunity: a Sunday broadcast competes against roughly 1,800 fewer streamers than the same broadcast on Wednesday, for nearly the same total viewer pool.
The Monday figure of 30.53 falls between Sunday and the mid-week range, suggesting a gradual transition rather than an abrupt shift. By Tuesday, streamer counts have risen substantially while viewer counts have not kept pace, compressing density to near-Wednesday levels.
Friday and Saturday show modest recovery — 27.64 and 28.92 respectively — as viewer counts increase toward weekend levels. But neither approaches Sunday's efficiency, because streamer counts also rise on these days.
The strategic implication of this data is direct: for a streamer with schedule flexibility, Sunday is the most efficient broadcast day by a significant margin. The assumption that weekends are low-value broadcasting windows is contradicted by the density data.
How Timing Differs by Category
The aggregate platform numbers conceal significant variation by content category. Different audiences have different schedules, and the optimal timing for one category is not optimal for another.
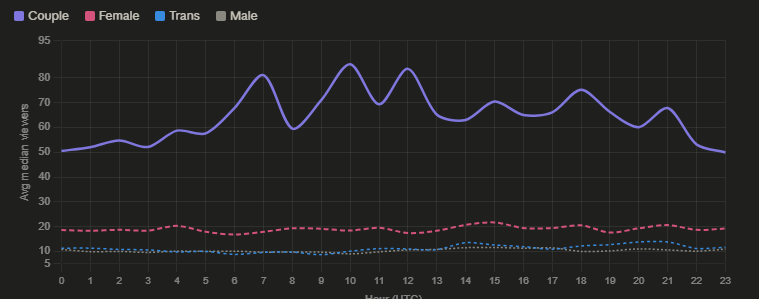
Couple streamers show the sharpest timing effects of any category.
| Hour (UTC) | Couple avg median | vs. day average |
|---|---|---|
| 10:00 | 85.5 | +45% |
| 12:00 | 83.6 | +42% |
| 07:00 | 81.1 | +38% |
| 23:00 | 49.9 | -15% |
| 22:00 | 53.1 | -10% |
The range from the best hour (85.5 at 10:00 UTC) to the worst (49.9 at 23:00 UTC) represents a 71% variation in median audience. A couple streamer who consistently starts at 10:00 UTC rather than 23:00 UTC would, on this data, expect to attract 71% more viewers per session for identical content.
The 10:00 UTC peak for couple content aligns with the platform-wide efficiency peak identified earlier — a case where category timing and platform timing reinforce each other. At 10:00 UTC, both total competition is lowest and couple-specific audience quality is highest.
Female streamers show the flattest timing response of any category.
The range from the best hour (21.7 at 15:00 UTC) to the worst (16.8 at 06:00 UTC) represents a 29% variation — less than half the couple category's 71% swing. For female streamers, timing optimization matters, but it matters substantially less than for other categories. The audience for female content is distributed more evenly across the day, likely reflecting a global viewer base spread across many time zones rather than concentrated in specific regions.
The 14:00–15:00 UTC window (36.0–37.6 avg peak) represents the best female performance, corresponding to afternoon in Europe and morning in the Americas — a window where both major viewer markets are accessible simultaneously.
Male streamers peak in the afternoon window.
The 14:00–17:00 UTC window consistently produces the best male-category performance (11.4–11.6 median), roughly aligning with the female afternoon peak but at a much lower absolute level. The timing pattern suggests similar audience geography — European afternoon, American morning — but a smaller total audience pool.
Trans streamers peak in the evening.
The 20:00–21:00 UTC window produces the highest trans-category median audiences at 13.8, a notably different timing profile from couple and female categories. This evening preference likely reflects a different viewer demographic with different daily schedule patterns.
When the High-Quality Streamers Actually Broadcast
The top-quality streamer data — sessions with median audiences above 200 — reveals a timing pattern that differs from aggregate recommendations.
| Hour (UTC) | Sessions | Avg median | Avg peak | Unique streamers |
|---|---|---|---|---|
| 12:00 | 338 | 598.7 | 1,095.5 | 238 |
| 17:00 | 342 | 558.8 | 980.5 | 276 |
| 22:00 | 291 | 545.0 | 917.5 | 220 |
| 18:00 | 408 | 543.3 | 1,010.5 | 298 |
| 04:00 | 341 | 529.1 | 961.6 | 224 |
| 00:00 | 284 | 518.6 | 993.9 | 211 |
| 11:00 | 366 | 526.9 | 968.9 | 264 |
The 12:00 UTC slot produces the highest median audience for top-quality sessions at 598.7, with a peak average of 1,095.5. This is a different peak than the platform-wide efficiency peak at 10:00–11:00 UTC, and different again from the couple-category peak at 10:00 UTC.
The 04:00 UTC slot is the most surprising entry: 529.1 median viewers, comparable to the 17:00 and 18:00 UTC windows that would typically be considered prime time. The 211–224 unique streamers starting sessions at midnight to 04:00 UTC suggest that a small number of established streamers have discovered that very late-night or very early-morning broadcasts, when competition is minimal, produce strong results for audiences with those specific schedules.
The volume of sessions is lowest at these late-night hours, which means the average is more susceptible to individual high-performing streamers skewing the result upward. But the pattern of consistently high median values across 00:00–04:00 UTC is too consistent across multiple hours to be entirely explained by outliers.
The Efficiency Window Framework
Combining the hourly, daily, and category data produces a framework for thinking about timing that is more nuanced than standard peak-hour recommendations.
The low-competition efficiency window: 09:00–11:00 UTC Fewest streamers online, highest viewers-per-model ratios, strong performance for couple content. Corresponds to morning in Europe, very early morning on the US East Coast. Not viable for most US-based streamers but potentially underexplored by European ones.
The balanced prime window: 14:00–18:00 UTC Best absolute performance for female content, strong total viewer counts, moderate competition. Corresponds to afternoon in Europe and morning in the Americas — the overlap window for two major viewing markets. The most competitive window but also the highest total opportunity.
The high-volume evening window: 19:00–22:00 UTC Highest total viewers, highest streamer counts, efficiency slightly below the morning window. Best for trans content. Most intuitive choice for streamers, which is also why competition is most intense here.
The late-night underexplored window: 00:00–04:00 UTC Surprisingly strong for established top-quality streamers, very low competition. Corresponds to late evening in the Americas. Viable primarily for streamers with established audiences who are willing to schedule unconventionally.
The Sunday structural advantage Regardless of category, Sunday broadcasting faces approximately 1,800 fewer competitors than Wednesday for a similar total viewer pool. For any streamer with schedule flexibility, this is the single most actionable timing insight in this dataset.
What Timing Cannot Fix
The timing data in this analysis measures when sessions achieve the best per-viewer outcomes across the platform. It does not measure whether a specific streamer's audience is present at those times.
A streamer whose existing followers are predominantly in Colombia or the Philippines has an audience that is largely active during hours that do not align with the platform-wide efficiency windows. Timing optimization for that streamer would require understanding when their specific audience is most active — a question the aggregate data cannot answer.
Similarly, the Sunday efficiency advantage reflects a platform-wide pattern. If a significant number of streamers read this analysis and shift their schedules toward Sunday, the advantage would diminish as competition increases and the structural imbalance corrects itself. Timing edges, unlike content quality edges, are inherently self-eroding as more participants learn about them.
The most durable timing insight in this data is not any specific hour or day recommendation — it is the underlying logic: optimize for viewers-per-streamer, not viewers in absolute terms. The best time to broadcast is when your target audience is present and your competitors are not. That calculation depends on category, geography, and audience composition in ways that no aggregate analysis can fully specify.
Data sourced from real-time platform analytics. Hourly and daily analysis from site_sync_stats covering April 14–21, 2026 (approximately 2,400 sync events). Gender timing analysis from model_life_cycles covering completed sessions during the same period. High-quality session analysis restricted to sessions with median audiences above 200 concurrent viewers.