The Session Quality Index: What the Numbers Behind the Numbers Actually Reveal

Peak viewers tell you about your best moment. Median viewers tell you about your typical session. P90 tells you about your stable floor. Stability ratio tells you how much of your peak you actually hold. None of these alone is sufficient. Together, they reveal something more useful than any single metric.
Every metric in live streaming measures a different slice of performance. Peak viewers capture the ceiling — the best a session reached. Median viewers capture the typical experience — what a viewer who arrived at a random point during the session would have seen. P90 captures the sustained floor — what performance looks like after excluding the weakest ten percent of measurements. The stability ratio — median divided by peak — captures how consistently a streamer holds their audience once it arrives.
This week we mapped all four metrics simultaneously across the platform and found patterns that challenge several common assumptions about what good performance looks like.
The Stability Paradox
The most counterintuitive finding in this week's data involves the relationship between audience stability and audience size.
| Stability tier | Streamers | Avg median | Avg peak | Avg total hours |
|---|---|---|---|---|
| High 70%+ | 8,103 | 29.9 | 40.1 | 5.9 |
| Mid 55–70% | 38,157 | 25.6 | 41.4 | 14.8 |
| Low 40–55% | 31,253 | 21.3 | 44.1 | 19.6 |
| Volatile <40% | 6,959 | 23.7 | 74.0 | 15.4 |
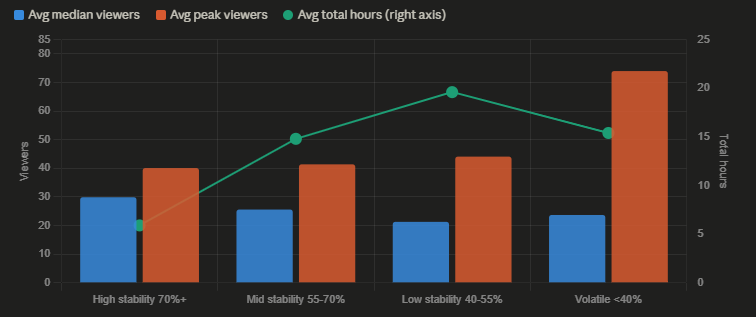
The high-stability group — streamers who maintain more than 70% of their peak audience throughout a session — achieves the highest median viewers at 29.9. But they do this in an average of only 5.9 hours of total broadcasting per week, less than a third of the low-stability group's 19.6 hours.
The volatile group — streamers whose median falls below 40% of their peak — shows the highest average peak viewers at 74.0, nearly double the high-stability group. They attract significant audiences at their best moments but cannot hold them.
Two structural types emerge from this data. The first is the consistent performer: relatively moderate peak audiences, high proportion retained throughout, short total broadcast hours. The second is the spike performer: high peaks, rapid decay, more time online overall. Neither profile is strictly better — they represent different relationships between streamer and audience.
What the stability ratio captures is essentially the difference between a streamer whose audience treats the stream as an event worth attending fully, versus one whose audience treats it as a browsing destination worth sampling briefly. Both can produce similar total viewing minutes across a session; the experience of each individual viewer is quite different.
Why Stability Ratio Matters More Than It Appears
The stability ratio is not widely discussed as a performance metric, partly because platforms do not surface it directly. The data suggests it encodes meaningful information about audience relationship quality.
Consider two hypothetical streamers, each achieving a peak of 1,000 viewers in a two-hour session.
Streamer A has a stability ratio of 75%: their median is 750, their P90 is around 850. Viewers who arrive early tend to stay. The session feels full throughout.
Streamer B has a stability ratio of 35%: their median is 350, their P90 is around 600. A large audience arrives at peak — perhaps driven by an algorithmic push or a spike in the room subject — then rapidly disperses. Most viewers sample and leave within minutes.
The peak viewer count is identical. The viewer experience is not. Streamer A is building an audience that stays; Streamer B is experiencing traffic that passes through.
The platform-wide data supports this distinction. High-stability streamers achieve meaningfully higher median audiences relative to their peaks, which means a larger proportion of viewers who arrive choose to stay for a substantial portion of the session. This is the behavior most directly associated with audience retention and, plausibly, follower conversion — though the data available here cannot confirm the conversion link directly.
The Top Quality Performers This Week
The combined quality analysis — requiring at least 100 median viewers, two or more sessions, and measuring stability ratio — produces a leaderboard that looks different from the peak-viewer rankings published elsewhere.
| Streamer | Sessions | Avg median | Avg peak | Avg P90 | Stability ratio | Total hours |
|---|---|---|---|---|---|---|
| zoepriceee | 4 | 3,746.5 | 4,564.8 | 4,338.5 | 82.1% | 14.4 |
| harleyysummers | 2 | 1,567.0 | 1,890.0 | 1,800.0 | 82.9% | 4.6 |
| mollyxxxmoon | 5 | 1,071.4 | 1,244.8 | 1,212.4 | 86.1% | 13.2 |
| lenaluxevip | 2 | 590.5 | 729.5 | 717.5 | 80.9% | 4.0 |
| projektmelody | 2 | 471.5 | 546.0 | 525.0 | 86.4% | 3.7 |
| gabiriver | 2 | 491.0 | 567.5 | 513.0 | 86.5% | 9.5 |
| lsqueen | 2 | 395.0 | 473.0 | 461.5 | 83.5% | 3.0 |
| cupofloveswhisper | 2 | 268.5 | 332.0 | 314.0 | 80.9% | 4.1 |
| littlesubgirl_ | 6 | 212.2 | 245.7 | 236.3 | 86.4% | 7.6 |
| dakota_32 | 6 | 204.3 | 216.2 | 210.0 | 94.5% | 42.1 |
Several cases here are worth examining individually.
zoepriceee tops the list by median audience at 3,746.5 — meaning the typical viewer present during any given measurement in their sessions this week saw approximately 3,747 other viewers. With a stability ratio of 82.1%, they held over four-fifths of their peak audience consistently across four sessions totaling 14.4 hours. This combination of scale and stability is rare at any level of streaming.
dakota_32 presents the most unusual profile in the table: a stability ratio of 94.5% — the highest in the dataset — maintained across six sessions totaling 42.1 hours. An audience that barely fluctuates across six separate sessions and 42 hours of broadcast time suggests either a very consistent content format that appeals to a highly specific repeat-viewing audience, or an unusually loyal subscriber base that shows up reliably regardless of session content. The 94.5% figure means that at almost any point during any of their sessions this week, approximately 94.5% of the peak audience was still present.
projektmelody achieves an 86.4% stability ratio across only 3.7 total hours — two sessions averaging under two hours each. High stability in short sessions is structurally easier to achieve than across long ones, so the comparison with dakota_32's 42-hour total requires caution. But the combination of 471.5 median viewers and 86.4% stability in brief sessions suggests an audience with strong intent to watch rather than browse.
littlealessia sits at the top of the stability ranking at 94.9%, but with only two sessions and a median audience of 267.5. The small session count means a single unusually stable session can dominate the average. This is the same sample-size caution that applies throughout the analysis.
P90 as a Quality Signal
The P90 metric — the 90th percentile of audience measurements within a session — strips out the weakest ten percent of observations. For a session with significant audience spikes and valleys, P90 approximates what performance looks like at sustained high points after removing the open-and-close low periods.
The platform-wide P90 distribution reveals a sharp stratification.
| Quality tier | Streamers | Avg median | Avg P90 | Avg sessions/week |
|---|---|---|---|---|
| Low (p90 <20) | 62,294 | 5.6 | 8.5 | 7.8 |
| Mid (p90 20–100) | 16,991 | 26.4 | 40.8 | 6.1 |
| High (p90 100–300) | 3,490 | 105.5 | 166.8 | 5.6 |
| Top (p90 300+) | 1,709 | 517.4 | 821.5 | 4.7 |
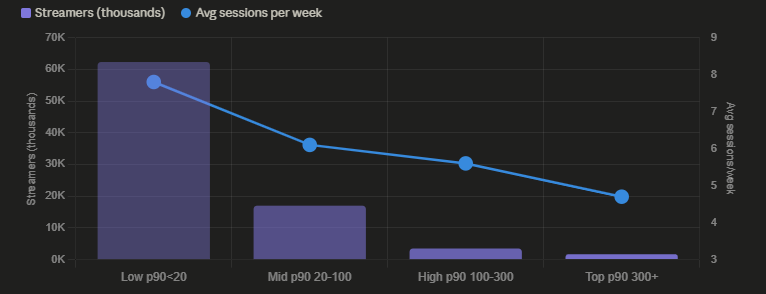
The inverse relationship between quality tier and session frequency reappears here, consistent with the overstreaming analysis from earlier in this series. Top-tier performers average 4.7 sessions per week; low-tier performers average 7.8. Higher-quality streamers stream less often.
The stratification is also extremely steep. The 62,294 low-tier streamers represent 74% of all streamers in the analysis — the overwhelming majority of active streamers are operating at a P90 below 20, meaning their sustained audience level rarely exceeds 20 concurrent viewers. The 1,709 top-tier streamers represent just 2% of the sample but achieve average P90 values of 821.5 — more than 96 times the low-tier average of 8.5.
This is a power law distribution more extreme than most industry discussions acknowledge. The top two percent of streamers by P90 quality are not performing moderately better than the median — they are performing at a categorically different level.
The Compounding Growth Problem
The follower growth data adds a dimension that connects audience quality to growth trajectory.
| Growth tier | Streamers | Avg gain | Avg starting followers |
|---|---|---|---|
| Micro (<100) | 80,817 | 23 | 6,695 |
| Small (100–1K) | 24,932 | 279 | 37,099 |
| Mid (1K–5K) | 2,222 | 1,860 | 139,712 |
| High (5K+) | 143 | 8,144 | 159,285 |
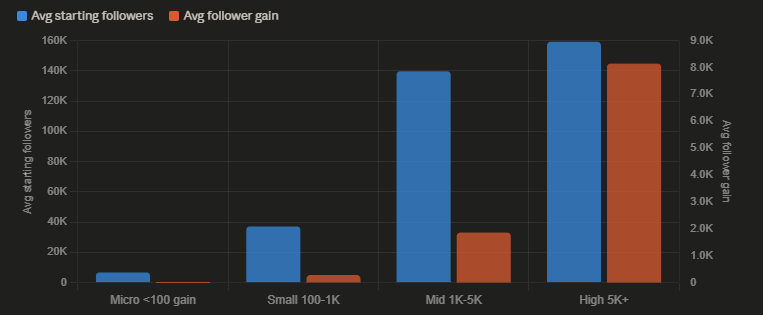
The high-growth tier — streamers gaining more than 5,000 followers this week — started with an average of 159,285 followers. The micro-growth tier started with 6,695. Absolute follower gain is strongly correlated with existing follower base, confirming the compounding dynamic observed in last week's analysis.
This creates a structural challenge for earlier-stage streamers that quality metrics alone cannot resolve. A streamer with a P90 of 200 and 5,000 followers is producing genuinely high-quality sessions — but their absolute follower gain will remain modest because the compounding mechanism that produces large gains requires a large base to compound from.
The implication is that the path from low-quality to high-quality streaming and the path from small audience to large audience are not the same journey. Quality improvements may be necessary but are not sufficient for the compounding growth that produces top-tier follower gains. The structural advantage of an existing large audience cannot be replicated through quality alone.
Building a Session Quality Index
The data in this analysis — median, peak, P90, stability ratio, session count, and total hours — can be combined into a single composite score for ranking purposes. A simple formulation might weight these components as follows.
A reasonable composite index would multiply average P90 (which captures sustained quality) by stability ratio (which captures consistency) and discount by session count above a threshold (which penalizes overstreaming). Something like:
SQI = avg_p90 × (stability_ratio / 100) × (1 / log(sessions + 1))
Applying this formula to the top performers in this week's data produces a ranking that differs meaningfully from both pure peak-viewer and pure follower-gain rankings. Streamers like dakota_32, who achieve exceptional stability across many sessions, score higher on such an index than streamers who peak dramatically but decay rapidly.
The limitation of any composite index is that the weights are arbitrary without longitudinal data to validate which combination of metrics best predicts long-term growth. The one-week data window available here is sufficient to observe current patterns but cannot confirm predictive relationships. The index proposed above is a framework for thinking about session quality, not a validated predictor.
What the data does establish is that peak viewers, the metric most commonly cited and displayed on platform interfaces, is the least useful single indicator of session quality among the four metrics analyzed. Peak is maximally sensitive to brief spikes that may not reflect sustained audience engagement. Median, P90, and stability ratio all carry more information about what the typical viewer experience actually was during a session.
What This Analysis Cannot Tell You
Session quality metrics measure what happened during sessions that were completed and recorded. They do not measure sessions that ended prematurely because audiences failed to materialize, which may systematically exclude the worst-performing sessions from any streamer's record.
The stability ratio calculation used here — median divided by peak — is sensitive to when the peak occurred within a session. A streamer who peaks in the first five minutes and then declines will show a lower stability ratio than one who peaks in the middle. The data does not record the timing of peaks within sessions, so this distinction cannot be made.
The P90 calculation excludes the weakest ten percent of measurements but does not account for how those measurements are distributed across the session. Two sessions with identical P90 values may have very different audience curves — one steady, one erratic — that the metric cannot distinguish.
These limitations do not invalidate the analysis. They establish its appropriate scope: session quality metrics are useful relative indicators of audience engagement, but they are not complete pictures of what is happening in any individual stream.
Data sourced from real-time platform analytics covering April 4–11, 2026. Stability ratio calculated as average median divided by average peak across all sessions in the measurement period, expressed as a percentage. P90 calculated from per-session sampling data collected at 8-minute intervals. Analysis restricted to streamers with at least two completed sessions to reduce single-session outlier effects.