The Geography Divide: Why the Same Tag Produces Opposite Results by Country
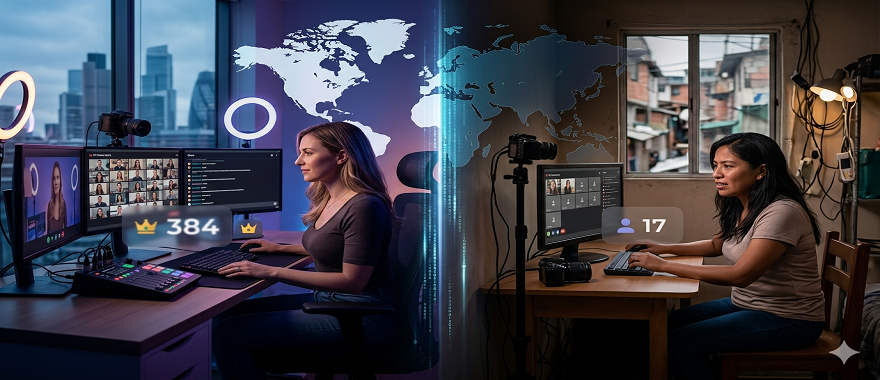
A UK streamer using the "18" tag attracts a median audience of 384. A Colombian streamer using the exact same tag on the exact same platform attracts 17. The tag is identical. The platform is identical. The gap is 22 times.
Country of origin is one of the most underanalyzed variables in live streaming. Most discussions of strategy focus on tags, timing, and frequency — all of which a streamer can control. Geography feels fixed, something to accept rather than analyze. The data suggests this framing is wrong. Understanding the geographic patterns in performance is not about changing where you are from — it is about understanding which structural forces are shaping your starting conditions, and how to work within them.
The Country Performance Baseline
This week's data covers female streamers across 20 countries with at least 50 active sessions. The range is wider than most analyses acknowledge.
| Country | Streamers | Avg median viewers | Avg followers | Avg session hours |
|---|---|---|---|---|
| AU | 109 | 207.3 | 61,368 | 2.2 |
| MX | 69 | 112.0 | 48,163 | 1.5 |
| GB | 299 | 82.2 | 53,636 | 1.6 |
| DE | 132 | 44.8 | 62,503 | 1.5 |
| US | 4,438 | 40.8 | 32,187 | 1.5 |
| CA | 404 | 37.1 | 37,539 | 1.7 |
| FR | 98 | 32.3 | 40,859 | 1.9 |
| AR | 108 | 28.0 | 36,209 | 1.7 |
| BR | 195 | 23.9 | 17,566 | 1.5 |
| RO | 826 | 16.1 | 25,381 | 2.6 |
| UA | 1,055 | 13.0 | 14,098 | 1.8 |
| CO | 19,782 | 10.1 | 14,185 | 3.3 |
| PH | 1,839 | 5.3 | 4,033 | 1.3 |
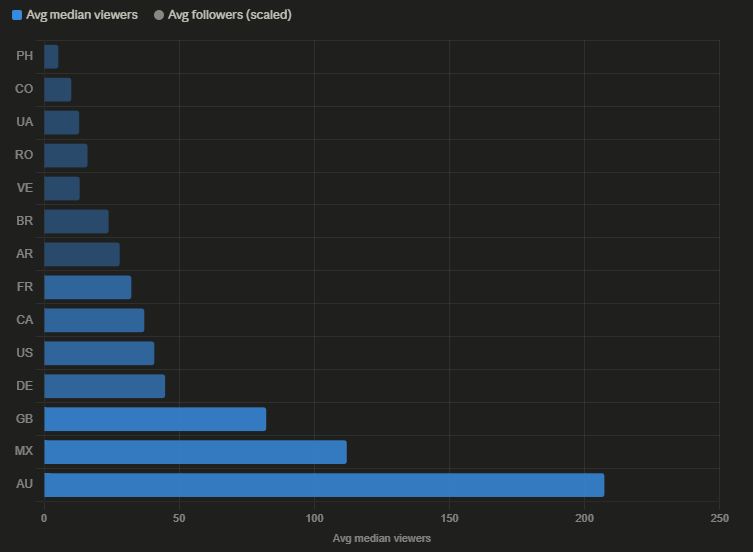
The first thing to note about Australia's 207.3 figure: the sample is only 109 streamers, which means a small number of high-performing accounts can significantly shift the average. The AU figure warrants caution. Among countries with larger samples, GB at 82.2 (299 streamers), US at 40.8 (4,438 streamers), and RO at 16.1 (826 streamers) provide more statistically stable reference points.
Two structural patterns are immediately visible.
High-performing countries — AU, MX, GB, DE, US — all have relatively small streamer counts combined with high average followers. Low-performing countries — CO, PH — have the opposite: enormous streamer counts and low average followers.
Colombia has 19,782 streamers in this dataset, more than four times the US total, yet achieves one quarter of the US median audience. The Philippines has 1,839 streamers and an average follower count of 4,033 — the lowest of any country in the table — with a median audience of 5.3.
Why Follower Count Does Not Fully Explain the Gap
The follower count difference between high and low-performing countries is real — GB streamers average 53,636 followers versus Colombia's 14,185. But follower count alone cannot explain a gap of this magnitude.
The tier-stratified data is more revealing.
| Country | Micro avg median | Small avg median | Mid avg median | Large avg median |
|---|---|---|---|---|
| GB | 14.1 | 27.2 | 59.9 | 501.4 |
| US | 13.3 | 19.9 | 53.4 | 262.2 |
| CA | 13.8 | 17.0 | 27.9 | 233.4 |
| DE | 9.5 | 28.9 | 27.9 | 176.6 |
| UA | 4.8 | 8.1 | 31.0 | 171.4 |
| RO | 6.1 | 11.7 | 26.0 | 72.6 |
| CO | 5.0 | 7.7 | 19.4 | 108.4 |
| PH | 3.9 | 7.4 | 29.8 | 47.9 |
At the micro tier — where follower count is comparable and minimal across all countries — the gap narrows considerably but does not disappear. A UK micro-tier streamer achieves 14.1 median viewers. A Colombian micro-tier streamer achieves 5.0. A Philippine micro-tier streamer achieves 3.9.
This matters because it rules out follower accumulation as the complete explanation. Even before a streamer has built any meaningful audience, country of origin is associated with a meaningful difference in baseline performance.
The large-tier gap is even more striking. UK streamers with over 100K followers achieve a median of 501.4 — nearly five times the 108.4 achieved by Colombian streamers at the same follower level, and more than ten times the Philippine figure of 47.9. Whatever structural advantage UK-based streamers have, it compounds as they grow.
The Same Tag, Dramatically Different Results
The tag-level data makes the geographic effect impossible to attribute to content differences alone.
| Tag | Country | Streamers | Avg median | Multiple vs lowest |
|---|---|---|---|---|
| 18 | GB | 27 | 384.4 | 49x |
| 18 | DE | 12 | 79.8 | 10x |
| 18 | US | 348 | 74.4 | 10x |
| 18 | CA | 28 | 53.3 | 7x |
| 18 | RO | 42 | 21.3 | 3x |
| 18 | UA | 155 | 18.5 | 2x |
| 18 | CO | 3,497 | 17.2 | 2x |
| 18 | PH | 232 | 7.8 | 1x (baseline) |
| teen | MX | 10 | 233.0 | 18x |
| teen | GB | 33 | 165.6 | 13x |
| teen | US | 284 | 64.1 | 5x |
| teen | CO | 2,509 | 13.2 | 1x |
| teen | PH | 108 | 13.1 | 1x (baseline) |
| lovense | GB | 89 | 88.1 | 14x |
| lovense | CA | 140 | 38.4 | 6x |
| lovense | US | 942 | 36.8 | 6x |
| lovense | CO | 5,342 | 11.0 | 2x |
| lovense | PH | 407 | 6.3 | 1x (baseline) |
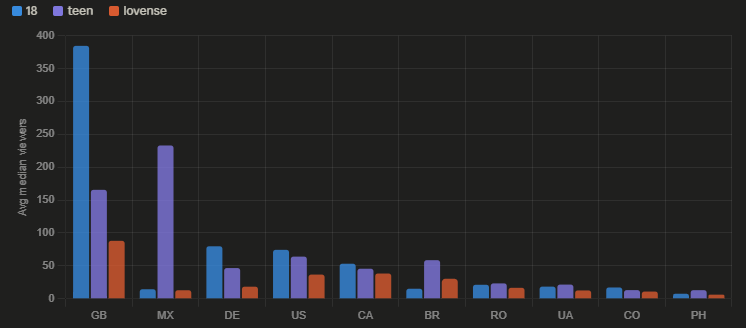
Three streamers, each using the lovense tag, each on the same platform: one from the UK achieving 88.1 median viewers, one from the US achieving 36.8, one from the Philippines achieving 6.3. The tag choice is identical. The platform is identical. The performance is not.
The Mexico figure for the teen tag — 233.0 — warrants particular attention. Only 10 streamers in the sample, which means the number is highly sensitive to individual outlier performance. The underlying pattern is real but the magnitude should be interpreted carefully given the small sample.
What Is Actually Driving the Geographic Gap
Several forces are likely operating simultaneously, and the data cannot cleanly separate them.
Production quality and infrastructure. A streamer in the UK or US typically has access to higher-bandwidth internet, better streaming equipment, and more stable technical conditions than a streamer in the Philippines or Colombia. Video quality, stream stability, and audio clarity all affect whether a viewer stays or leaves within the first 30 seconds. These differences are real and measurable but invisible in the audience count data.
Language and audience match. English-speaking streamers — primarily from the US, UK, Canada, and Australia — have access to the largest single-language audience on western platforms. A Colombian streamer broadcasting in Spanish is competing for a smaller addressable audience, even if her content is comparable in quality. This is not a content limitation; it is an audience distribution reality.
Audience purchasing power and spending patterns. The viewers most likely to spend tokens or subscribe tend to be concentrated in high-income countries. A streamer attracting 20 viewers from the US is likely to generate more platform revenue than a streamer attracting 20 viewers from any lower-income market. The median viewer count data does not capture this dimension — it counts heads, not spending. A Colombian streamer with 10 viewers may be generating more revenue than a Philippine streamer with 15, depending on viewer origin.
Platform algorithmic factors. Whether the platform's recommendation and discovery systems weight streams differently based on streamer location or viewer-streamer geographic matching is not documented publicly. The consistency of the geographic gap across multiple tags and follower tiers suggests some structural factor beyond content quality — algorithmic weighting is a plausible contributor, but this cannot be confirmed from the data available.
How Timing Interacts with Geography
The hourly data reveals that the timing advantage documented in earlier analyses is not uniformly available across all countries.
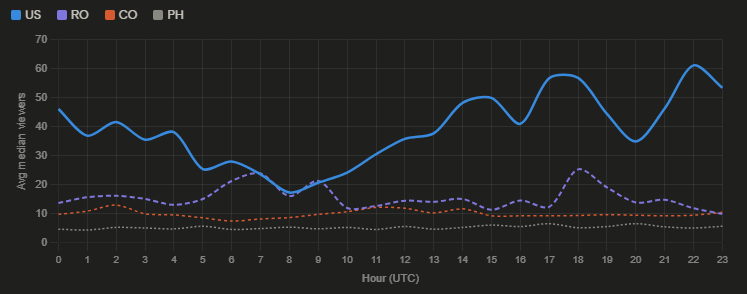
| Country | Best window (UTC) | Peak median | Worst window | Trough median | Variance |
|---|---|---|---|---|---|
| US | 22:00–18:00 | 61.1 | 08:00–09:00 | 17.3 | High |
| RO | 06:00–07:00 | 23.9 | 23:00 | 9.9 | Moderate |
| CO | 11:00–12:00 | 12.2 | 06:00 | 7.5 | Low |
| PH | 17:00–20:00 | 6.6 | 01:00 | 4.4 | Negligible |
US streamers exhibit the strongest timing effects of any country in the dataset. At 22:00 UTC — corresponding to early evening on the US East Coast — the average median audience reaches 61.1. At 08:00–09:00 UTC, which falls during US working hours, it drops to 17–21. The swing is nearly 3.5 times between best and worst hours, giving US-based streamers a meaningful tactical lever.
Romanian streamers show a moderate timing effect, peaking at 06:00–07:00 UTC as European audiences begin their day. The 25.3 spike at 18:00 UTC likely reflects the evening hours for Romanian viewers (20:00–21:00 local time). The pattern is consistent with a European audience base with predictable daily rhythms.
Colombian streamers show very little timing variation — the range runs from 7.5 at 06:00 UTC to 12.2 at 11:00–12:00 UTC, a difference that is real but small in absolute terms. The flat profile suggests that Colombian streamer performance is less sensitive to when they broadcast, which is consistent with serving an audience spread across multiple time zones or one that watches opportunistically rather than at fixed times.
Philippine streamers show almost no timing effect at all. The entire 24-hour range runs from 4.4 to 6.6 median viewers — a gap of 2.2 viewers across all hours. Timing optimization is essentially irrelevant for Philippine-origin streamers at their current performance level.
The practical implication is that the timing advice most commonly offered — stream during peak hours, avoid off-peak windows — applies primarily to streamers already operating above a baseline performance level. For streamers whose structural conditions limit them to single-digit median audiences regardless of timing, scheduling optimization is not the constraint that matters most.
Colombia: A Case Study in Market Saturation
Colombia's numbers tell a specific story that goes beyond typical geographic variation.
With 19,782 female streamers in the dataset — more than the US, UK, Canada, Germany, and France combined — Colombia represents an extreme case of supply-side saturation within a single country. The average Colombian streamer has 14,185 followers and achieves 10.1 median viewers per session. The average Colombian streamer is online for 3.3 hours per session, longer than any other country in the table.
The extended session length combined with low audience numbers is consistent with the over-streaming pattern documented earlier in this series. Colombian streamers appear to compensate for low per-session performance with more time online — a strategy the data suggests is ineffective and may be counterproductive.
The large-tier Colombian streamer — those with over 100K followers — achieves 108.4 median viewers. This is below the mid-tier performance of UK streamers (59.9) and roughly half the large-tier performance of US streamers (262.2). The structural disadvantage persists even after controlling for follower accumulation.
What the Geographic Gap Cannot Tell You
The data in this analysis measures where streamers are located according to their platform profile. It does not measure where their audiences are located, which would be the more directly relevant variable for understanding demand-side dynamics.
A Colombian streamer whose audience is primarily located in the US or Europe would face different competitive conditions than the country-level data implies. Conversely, a US-based streamer whose audience is primarily domestic faces the same viewer pool as other US streamers — the geographic label does not automatically confer access to high-spending viewers if content and discovery factors do not direct those viewers to their stream.
The geographic patterns documented here are strong enough to be structural rather than coincidental. But they are correlates, not deterministic constraints. Within every country, there are streamers significantly outperforming their country average — a point the tier data makes clear by showing that large-tier streamers exist and achieve meaningful audiences even in lower-performing countries.
Data sourced from real-time platform analytics covering April 4–11, 2026. Country classifications reflect streamer-reported location. Sample sizes vary significantly by country — AU (109), MX (69) results should be interpreted with caution given smaller samples. All viewer counts reflect concurrent viewers at time of measurement.