The Attention Squeeze: Why More Streamers Means Less for Everyone

The number that matters isn't your viewer count, your follower growth, or your token earnings. Those tell you how you are doing. They say nothing about whether the water you're swimming in is getting warmer or colder.
There is one metric almost nobody in live streaming talks about — but it may be the most important of all.
We call it viewers per model: total concurrent viewers divided by total streamers online at any given moment. When it rises, the market is expanding and opportunity flows to everyone. When it falls, competition tightens — even if you haven't changed a single thing about what you do.
Over the past two weeks, we tracked this number every day. What we found should concern anyone building a streaming career right now.
The Core Metric: Four Key Numbers This Week
| Metric | Value | Change |
|---|---|---|
| Peak viewers/model | 36.95 | Mar 27 high |
| Current viewers/model | 26.71 | -28% in 13 days |
| Avg streamers online | 8,739 | +19% vs Mar 27 |
| Total viewers | ~233,000 | Flat |
Thirteen Days. Twenty-Eight Percent.
On March 27, the average streamer was reaching 36.95 concurrent viewers. By April 9, that figure had fallen to 26.58. In thirteen days, the average streamer lost more than a quarter of their audience — not because their content got worse, but because the competitive landscape shifted beneath them.
Viewers Per Model — Daily Trend
| Date | Streamers Online | Total Viewers | Viewers / Model |
|---|---|---|---|
| Mar 27 | 7,344 | 271,386 | 36.95 ↑ |
| Mar 28 | 8,264 | 296,177 | 35.84 |
| Mar 29 | 8,572 | 290,704 | 33.91 |
| Mar 30 | 8,658 | 299,430 | 34.58 |
| Mar 31 | 8,204 | 271,731 | 33.12 |
| Apr 1 | 7,683 | 214,012 | 27.86 ⚠️ |
| Apr 2 | 6,937 | 211,925 | 30.55 |
| Apr 3 | 6,154 | 210,620 | 34.22 |
| Apr 4 | 6,636 | 214,752 | 32.36 |
| Apr 5 | 6,399 | 214,835 | 33.57 |
| Apr 6 | 7,017 | 227,169 | 32.37 |
| Apr 7 | 8,054 | 227,312 | 28.22 |
| Apr 8 | 8,180 | 220,866 | 27.00 |
| Apr 9 | 8,559 | 227,489 | 26.58 ↓ |
| Apr 10 | 8,739 | 233,367 | 26.71 |
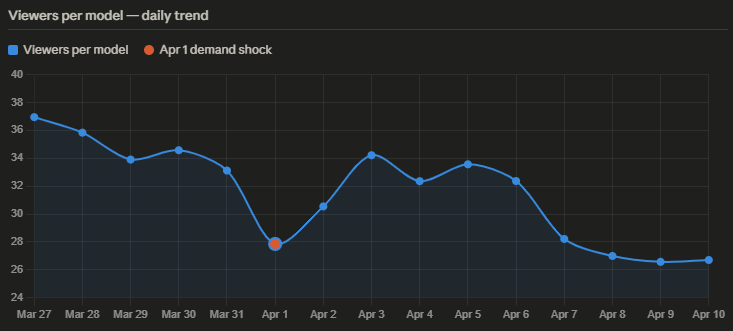
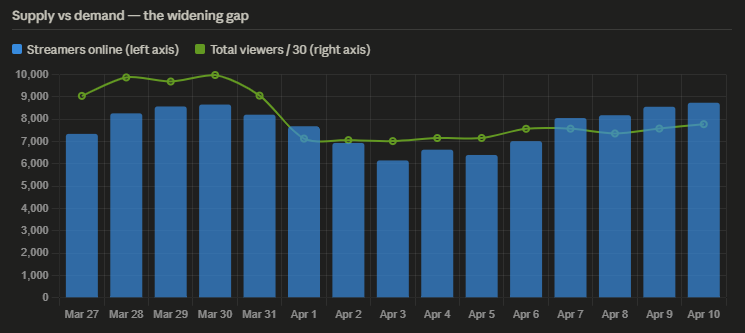
The pattern is unmistakable: total viewership bounced between 211K and 299K with no meaningful growth trend. Meanwhile, streamers online climbed steadily from 7,344 to 8,739 — a 19% increase. The pie stayed the same size. More hands reached in.
What Happened on April 1st
The daily data contains one sharp signal worth examining on its own.
On April 1st, viewers per model fell from 33.12 to 27.86 in a single day — a drop of more than 15% overnight. The cause was not a surge in streamers. Streamer count actually fell slightly. The cause was a sudden collapse in total viewership — down from 271,000 to 214,000, a 21% demand decline with almost no change in supply.
This is what makes attention markets so unstable. Supply — streamers deciding to go live — is sticky. People schedule streams, build routines, commit to their setup. Demand — viewers deciding to watch — is volatile. It responds to mood, external events, algorithm changes, whatever else is competing for attention on any given Tuesday.
When demand collapses and supply holds steady, viewers per model falls hard and fast. The streamers already sitting at five or six concurrent viewers on a good day suddenly find themselves at two or three. The math is unforgiving.
The Average Is a Lie
Here is the uncomfortable truth about the 26.71 figure: it flatters most streamers.
Platform attention does not distribute evenly. It concentrates. A small number of top streamers capture a disproportionate share of total viewership, pulling the average upward for everyone below them.
This week's session quality data makes this concrete:
| Streamer | Median Viewers | Peak Viewers | Hours Streamed |
|---|---|---|---|
| bailey_eilish | 5,721 | 7,070 | 4.0h |
| gracieparker | 5,374 | 6,852 | 2.8h |
| sugarpoppyxo | 5,281 | 8,283 | 17.1h (4 sessions) |
| floret_joy | 4,892 | 7,820 | 5.8h |
| nakedbakers | 4,682 | 7,367 | 4.4h |
These numbers exist in a completely different universe from the platform average of 26.71. Every viewer sitting in a top streamer's room is a viewer not sitting in someone else's.
The real figure for the long tail of streamers — the tens of thousands with single-digit concurrent viewers — is not 26. It is closer to three or four.
The Over-Streaming Trap
The instinct when competition tightens is to work harder. Stream more often. Be online when others are not.
The data suggests this instinct is actively counterproductive.
Activity Level vs Audience Quality
| Sessions Per Week | Streamers | Avg Peak Viewers |
|---|---|---|
| 10+ sessions | 7,127 | 26.5 ← worst |
| 5–9 sessions | 19,966 | 48.7 |
| 1 session | 21,783 | 43.0 |
| 2–4 sessions | 40,071 | 72.1 ← best |
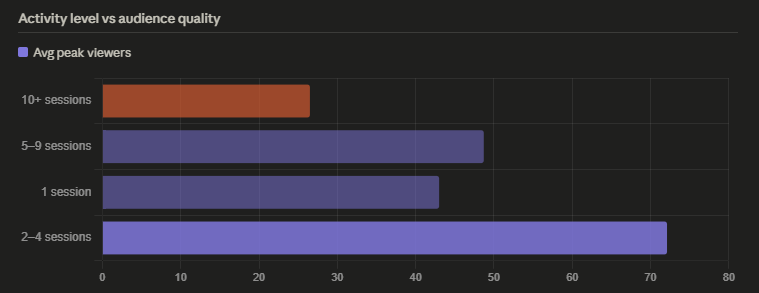
Streamers broadcasting 10+ times per week average a peak audience of just 26.5 viewers — less than half those who stream just 2–4 times per week (72.1).
More time online is not translating into more viewers. It is diluting single-session quality while contributing to the very supply glut that drives everyone's numbers down.
The streamers achieving the best results operate on a different logic: scarcity, not availability. By streaming selectively, they create anticipation. Their audience knows a session is an event, not a background fixture. When they go live, viewers show up. When they are always live, viewers stop noticing.
There is also a second-order effect most streamers miss. Every additional hour any streamer spends online increases the denominator in the viewers per model equation for the entire platform. The over-streamer is not just hurting themselves — they are contributing to the competitive pressure everyone else is also feeling.
Which Categories Are Holding Up
Not every segment is feeling this squeeze equally.
Viewers Per Model by Gender
| Category | Streamers | Avg Viewers/Session | vs Platform Avg |
|---|---|---|---|
| Couple | 4,227 | 60.4 | +126% |
| Female | 46,014 | 17.5 | -35% |
| Trans | 6,747 | 10.2 | -62% |
| Male | 31,903 | 9.9 | -63% |
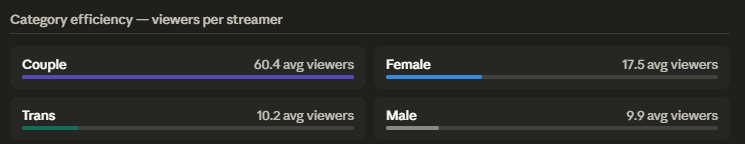
Couple streamers — just 4,227 active this week — maintain an average of 60.4 viewers per session, more than 3× the female average and 6× the male average. The reason is straightforward: supply is constrained. In a market where most categories are saturated, scarcity creates durable value.
Tag Competition: Audience Density vs Streamer Count
| Tag | Streamers | Avg Viewers | Saturation |
|---|---|---|---|
| teen | 6,462 | 38.1 | Low |
| 18 | 8,246 | 37.2 | Low |
| skinny | 5,163 | 29.8 | Low |
| young | 6,452 | 28.7 | Medium |
| squirt | 10,519 | 22.3 | High |
| lovense | 12,336 | 22.1 | Very high |
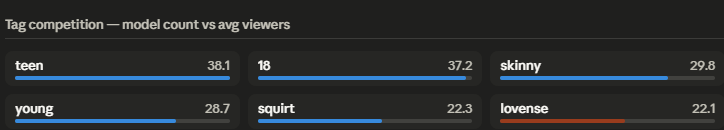
The pattern is consistent: the tags with highest average viewers are not the biggest — they are the ones where the audience-to-streamer ratio remains favorable. That ratio is eroding fastest in the most crowded categories.
lovense has 12,336 streamers competing for the same viewer pool. teen has 6,462 and delivers 72% higher average viewership.
Weekly Platform Trends
Platform Activity by Day
| Date | Max Online | Peak Viewers | Avg Viewers/Session |
|---|---|---|---|
| Apr 4 (Sat) | 7,896 | 5,843 | 32.36 |
| Apr 5 (Sun) | 7,329 | 7,936 | 33.57 |
| Apr 6 (Mon) | 9,024 | 8,365 | 32.37 |
| Apr 7 (Tue) | 9,411 | 7,252 | 28.22 |
| Apr 8 (Wed) | 9,642 | 7,367 | 27.00 |
| Apr 9 (Thu) | 8,559 | 7,894 | 26.58 |
| Apr 10 (Fri) | 10,288 | 8,283 | 26.71 |
A weekly rhythm is visible in the data. Sundays and Mondays consistently produce higher viewers-per-model ratios, while mid-week (Wednesday through Friday) shows the sharpest compression. For streamers choosing when to broadcast, timing within the week matters as much as frequency.
Three Scenarios for Where This Goes
Viewers per model has fallen from 36.95 to 26.71 in two weeks. Extrapolate forward and the number drops below 20 within a month. What happens then?
Scenario 1 — Demand recovery (optimistic) Something drives a meaningful increase in total viewership. If total viewers climb from the current ~230K toward 350K+, the competitive pressure eases. There is no evidence in the current data suggesting this is imminent.
Scenario 2 — Natural market correction (neutral) As returns diminish, some streamers reduce their hours or stop entirely. Supply falls, the remaining audience redistributes to those who stayed, and the figure stabilizes. This is how competitive markets self-correct — but the process is measured in months, not weeks.
Scenario 3 — Continued compression (likely) Supply keeps growing, demand stays flat, and viewers per model continues downward. At some point the economics become untenable for a significant portion of streamers, triggering a faster correction. The people who survive will be those who built something that cannot be competed away — a loyal audience, a distinctive identity, a presence that exists beyond the platform itself.
The current data points toward Scenario 3.
What This Means in Practice
Three adjustments worth considering:
1. Stream less, not more The evidence on activity level versus audience quality is clear. Streamers broadcasting 2–4 times per week outperform those online 10+ times by nearly 3×. If you are currently streaming daily, experiment with pulling back and observe whether per-session numbers improve.
2. Choose your competitive environment deliberately The tags and categories you operate in determine the local supply-demand ratio you are working against. lovense has 12,336 competitors. skinny has 5,163 and maintains audiences 35% higher. The category you choose is as important as the content you create within it.
3. Build something off-platform When the platform's internal dynamics are working against you, dependence on platform discovery becomes a structural vulnerability. An audience that follows you because they chose to — not because an algorithm surfaced you — is an audience that survives the squeeze.
We Are Tracking This Weekly
Viewers per model is the single metric we will watch every week going forward. It is a real-time indicator of how competitive the platform is becoming — one number that captures the relationship between supply, demand, and your potential audience in a single figure.
Next week's data will tell us whether the current trend is continuing, accelerating, or showing early signs of reversal. If the number breaks below 25, we will look at which categories and time slots are absorbing the pressure first.
The streamers who understand what this number means — and adjust accordingly — will be better positioned than those flying blind.
Data sourced from real-time platform analytics. Analysis period: March 27 – April 11, 2026. All viewer counts reflect concurrent viewers at time of measurement.